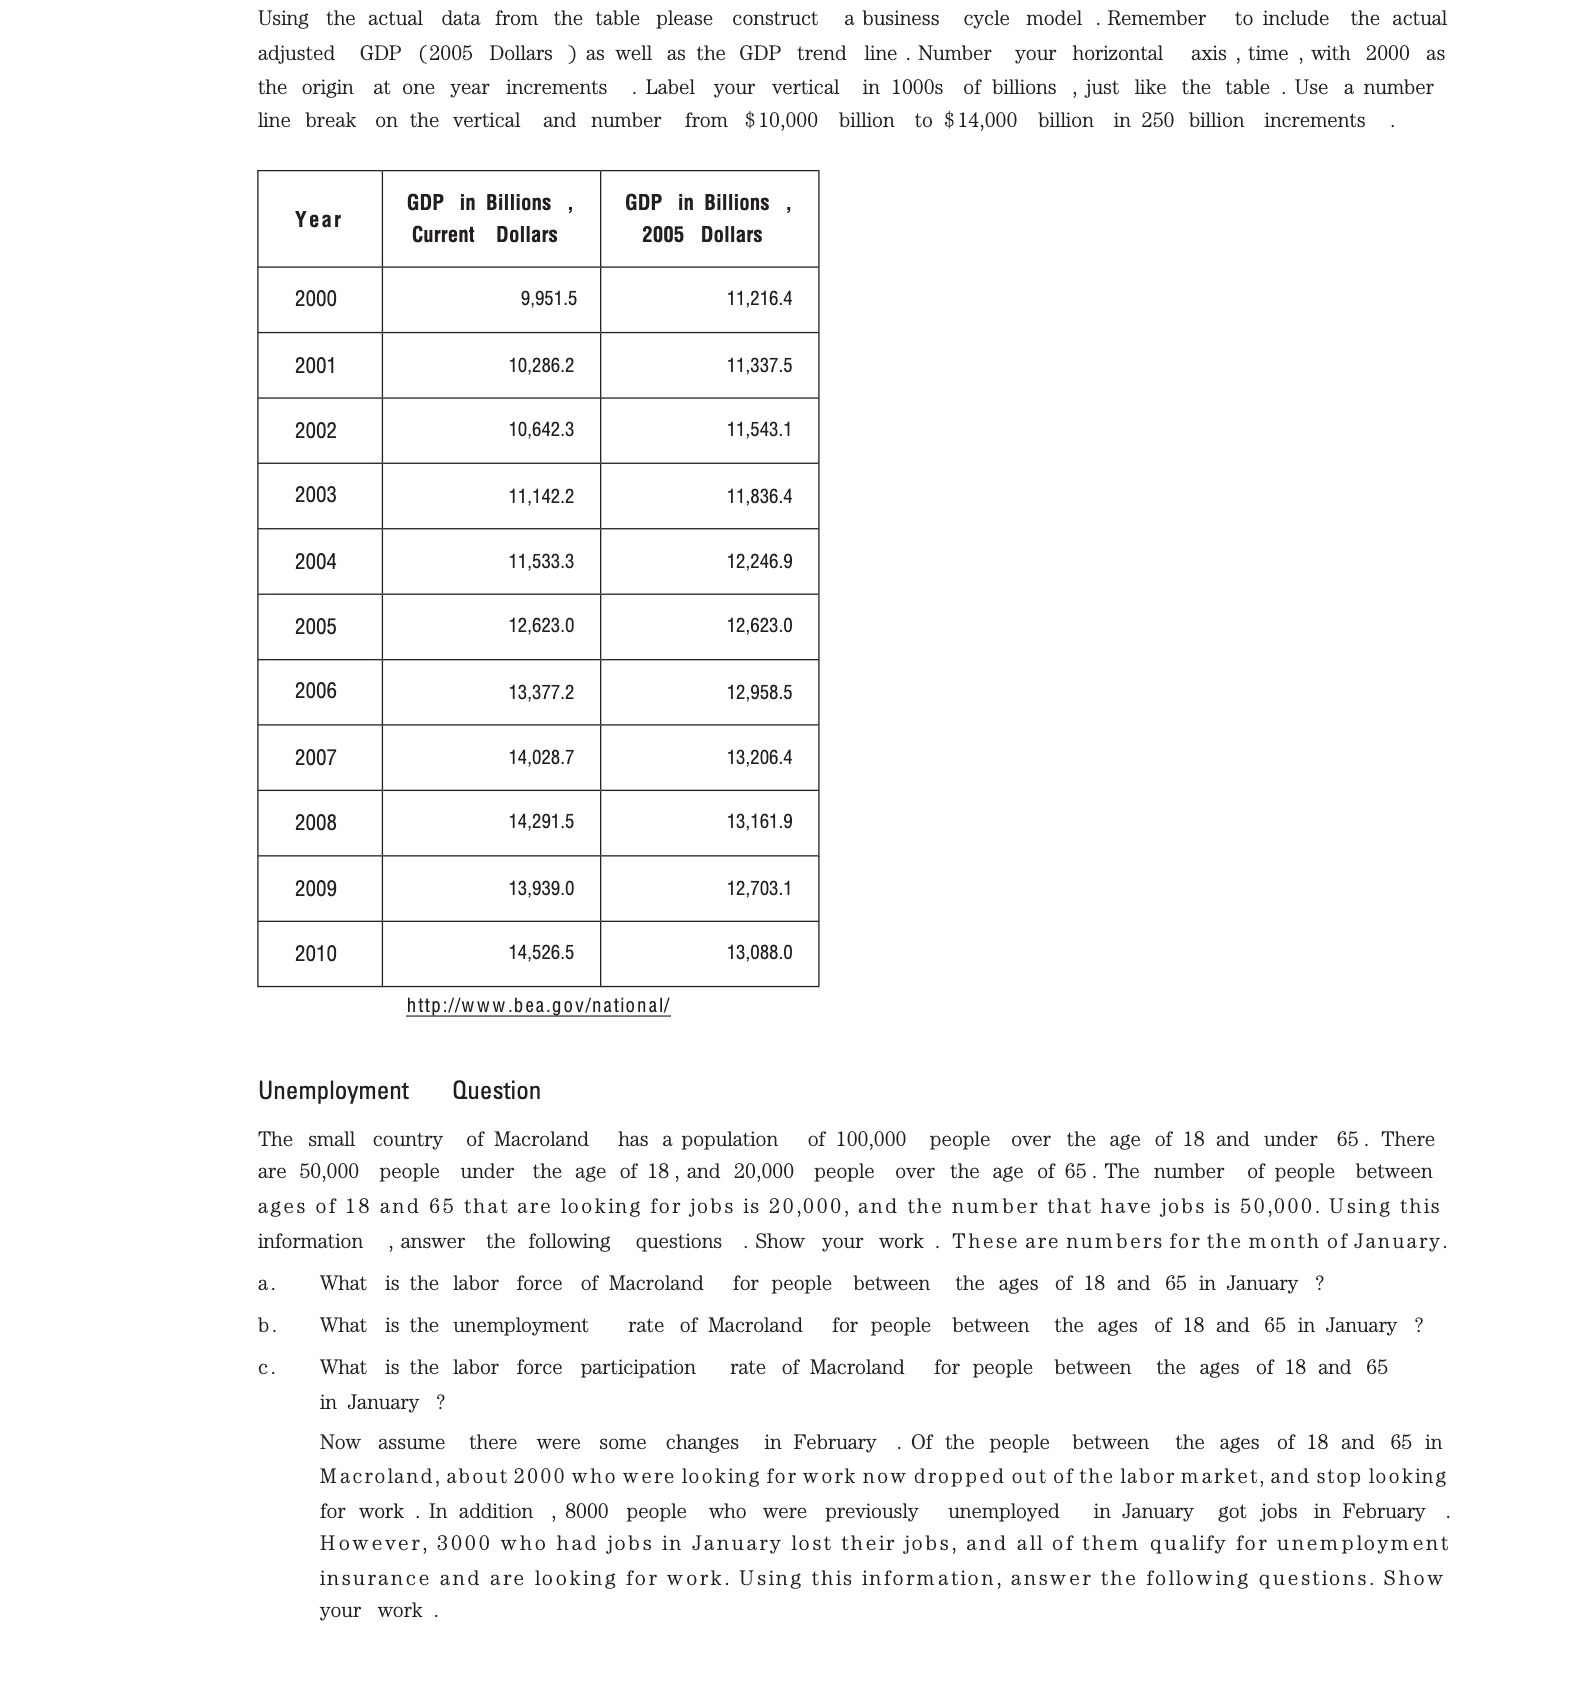
Using the actual data from the table please construct abusiness cycle model .Remember to include the actual adjusted GDP (2005 Dollars )as well as the GDP trend line . Number your horizontal axis , time ,with 2000 as the origin at one year increments . Label your vertical in 1000s of billions , just like the table . Use a number line break on the vertical and number from $10,000 billion to $14,000 billion in 250 billion increments GDP in Billions , GDP in Billions , Current Dollars 2005 Dollars 9,951.5 11,215.4 10,286.2 11,3315 2002 10,542.31 11 ,543.1 2003 11,142.2 11,835.4 m 2009 13,939.0 12,703.1 2010 14,525.5 13,088.0 hltp:llwww.bea.gov!n ationall' Unemployment Question The small country of Macroland has a population of 100,000 people over the age of 18 and under 65. There are 50,000 people under the age of 18,and 20,000 people over the age of 65. The number of people between ages of 18 and 65 that are looking for jobs is 20,000, and the number that have jobs is 50,000. Using this information , answer the following questions . Show your work . These are numbers for the month of January. a. What is the labor force of Macroland for people between the ages of 18 and 65 in January ? b. What is the unemployment rate of Macroland for people between the ages of 18 and 65 in January ? c. What is the labor force participation rate of Macroland for people between the ages of 18 and 65 in January ? Now assume there were some changes in February .Of the people between the ages of 18 and 65 in Macroland, about 2000 who were looking for work now dropped out of the labor market, and stop looking for work . In addition , 8000 people who were previously unemployed in January got jobs in February However, 3000 who had jobs in January lost their jobs, and all of them qualify for unemployment insurance and are looking for work. Using this information, answer the following questions. Show your work