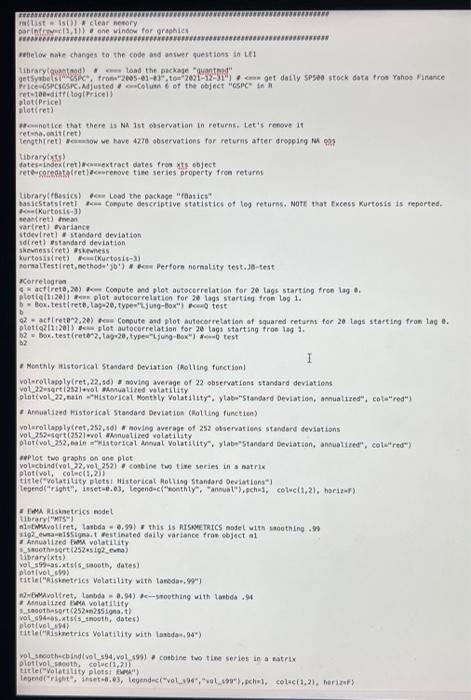
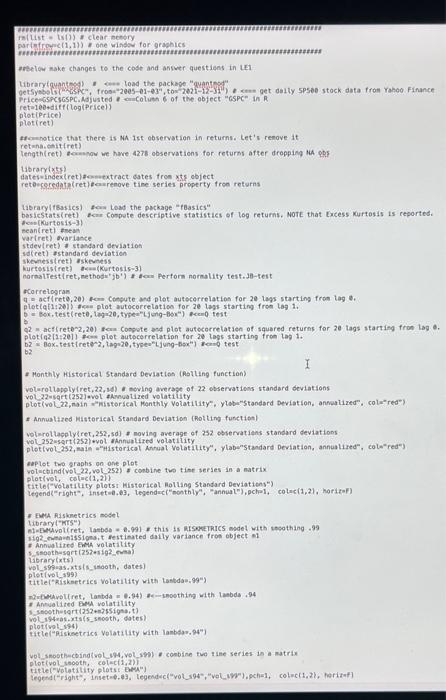
Using the attached R code (lel.R) get the daily equity prices data for the Japanese Nikkei 225 stock index for the period 2005/01/04-2021/12/31 from finance.yahoo.com (use Note that you need to make several changes in the code, such as replacing GSPC index with N225 and several other parameters in the code. 1. Compute the log returns for Nikkei and find the statistics below. a) Find the mean annualized return. b) Find the annualized volatility (standard deviation for the whole sample). c) Find the skewness and kurtosis and explain if there is any asymmetry and fat tails? d) Formulate and test the efficient market hypothesis (EMH) using the Q test for returns for k=15 autocorrelations. e) Formulate and test the null hypothesis of no volatility clustering using the Q test for squared returns for k=15 autocorrelations. 2. Using the same data find annualized Monthly and Annual historical volatilities for the whole period. Here use moving average standard deviations with monthly (22 days) window and annual ( 252 days) window. Ih both cases annualize the volatilities using sqrt(252) multiplier since we use daily data. Present a plot of both volatilities on one graph. Do you observe that volatilities are changing over time? What are the main events that caused volatility peaks for Nikkei index? 3. Find exponentially weighted volatilities (EWMA) using .94 and .98 as the smoothing parameter. Plot both of these series on the same graph and attach it. Which parameter gives smoother volatility graph? arinfigwht (1,1)} b one window fop grepkici 1ibrary in tit). verefrelogray 62 * Menthiy wistorical steadafd beviatsen fhating furctiont wol 22019rt 2921+v01 minuahlired vidatifity *wilge fue grashs on ane plof: Yolucoindivol 22. vol 2521 ef coablfer tay fife series in a natrix a twai, if shaetrics redel. Hibratiol HyTS=) tiforary\{xta\}) * f.*ual1zed lam yotat illify tiffe (*isis breteica Yelatilify with 1 asdada +9d) Using the attached R code (lel.R) get the daily equity prices data for the Japanese Nikkei 225 stock index for the period 2005/01/04-2021/12/31 from finance.yahoo.com (use Note that you need to make several changes in the code, such as replacing GSPC index with N225 and several other parameters in the code. 1. Compute the log returns for Nikkei and find the statistics below. a) Find the mean annualized return. b) Find the annualized volatility (standard deviation for the whole sample). c) Find the skewness and kurtosis and explain if there is any asymmetry and fat tails? d) Formulate and test the efficient market hypothesis (EMH) using the Q test for returns for k=15 autocorrelations. e) Formulate and test the null hypothesis of no volatility clustering using the Q test for squared returns for k=15 autocorrelations. 2. Using the same data find annualized Monthly and Annual historical volatilities for the whole period. Here use moving average standard deviations with monthly (22 days) window and annual ( 252 days) window. Ih both cases annualize the volatilities using sqrt(252) multiplier since we use daily data. Present a plot of both volatilities on one graph. Do you observe that volatilities are changing over time? What are the main events that caused volatility peaks for Nikkei index? 3. Find exponentially weighted volatilities (EWMA) using .94 and .98 as the smoothing parameter. Plot both of these series on the same graph and attach it. Which parameter gives smoother volatility graph? arinfigwht (1,1)} b one window fop grepkici 1ibrary in tit). verefrelogray 62 * Menthiy wistorical steadafd beviatsen fhating furctiont wol 22019rt 2921+v01 minuahlired vidatifity *wilge fue grashs on ane plof: Yolucoindivol 22. vol 2521 ef coablfer tay fife series in a natrix a twai, if shaetrics redel. Hibratiol HyTS=) tiforary\{xta\}) * f.*ual1zed lam yotat illify tiffe (*isis breteica Yelatilify with 1 asdada +9d)