Question
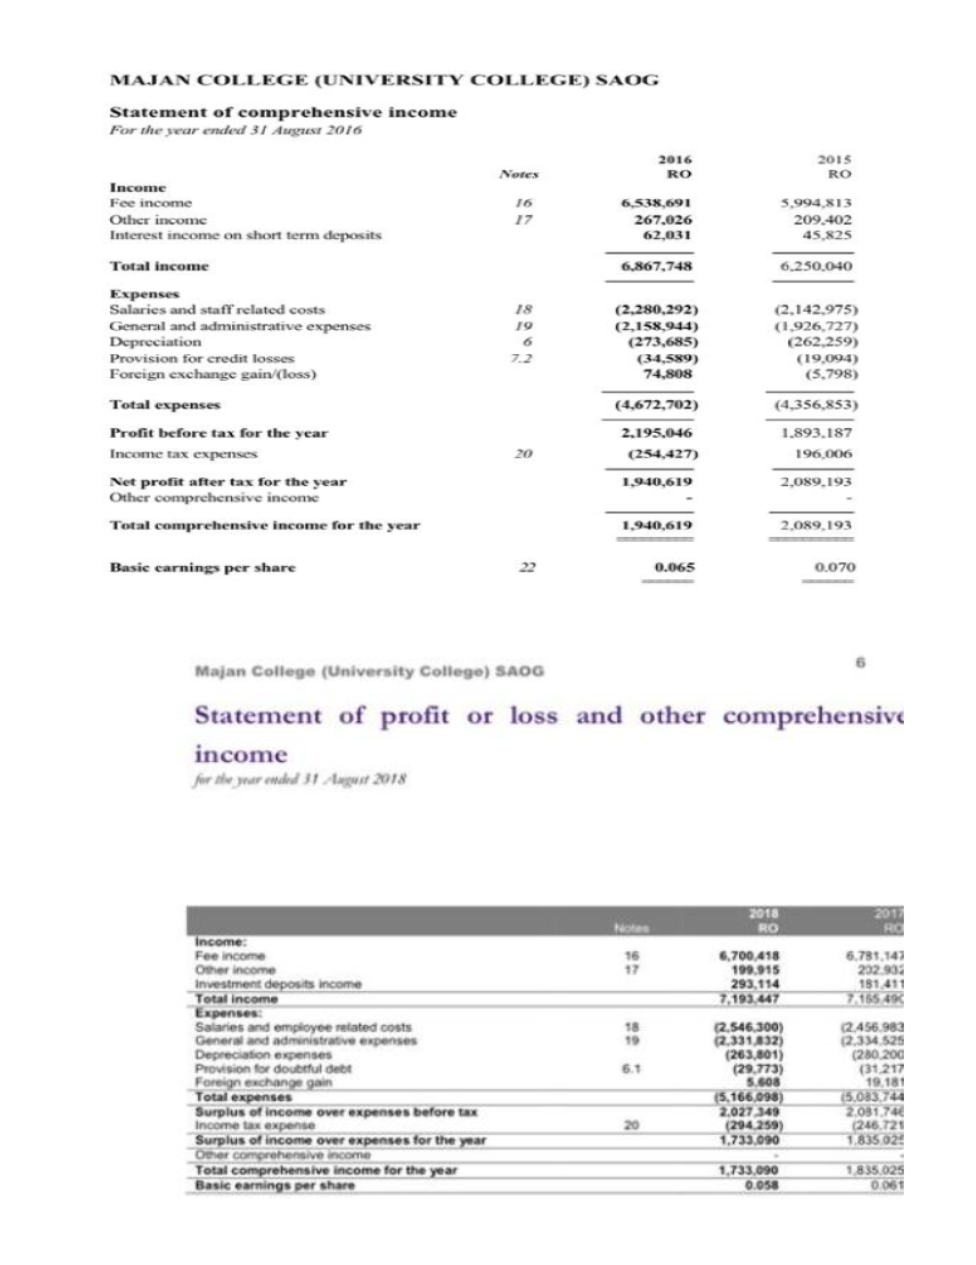
Using the balance sheet and income statement from 2015 to 2018 Calculate financial ratios and analyze the position of Majan College by following the steps
Using the balance sheet and income statement from
2015 to 2018
Calculate financial ratios and analyze the position
of Majan College by following the steps given below.
a. Prepare common size balance sheet and income statement,
mark the changes from 2015 to 2018.

b. Analyze the financial position from time series viewpoint.
Break your analysis into evaluations of the firm's Liquidity
(current and quick), Asset management (inventory receivables
&total asset turnover, leverage (Debt-equity ratio),
profitability (ROE, Net profit margin), and market value ratios
(EPS and PE)
**Use APA style referencing
MAJAN COLLEGE (UNIVERSITY COLLEGE) SAOG Statement of comprehensive income For the year ended 31 August 2016 2016 2015 Notes RO RO Income Fee income 5,994,813 16 6,538,691 Other income Interest income on short term deposits 209.402 45,825 17 267.026 62,031 Total income 6,867.748 6.250.040 Expenses Salaries and staff related costs General and administrative expenses Depreciation Provision for credit losses Foreign exchange gain/(loss) 18 (2,280,292) (2,158,944) (273,685) (2,142,975) (1,926,727) (262,259) (19,094) (5,798) 19 6 7.2 (34,589) 74,808 Total expenses (4,356,853) (4,672,702) Profit before tax for the year 2.195,046 1.893.187 Income tax expenses 20 (254,427) 196,006 Net profit after tax for the year Other comprehensive income 1,940,619 2,089,193 Total comprehensive income for the year 2,089,193 1,940,619 Basic carnings per share 0.070 0.065 Majan College (University College) SAOG Statement of profit or loss and other comprehensive income for the year ended 31 Agust 2018 2017 RO 2018 RO Notes Income 6,700 418 199,915 293.114 7.193,447 6.781,147 202.932 181 411 7.165 49 Fee income Other income Investment deposits income Total income Expenses: Salaries and employee related costs General and administrative expenses Depreciation expenses Provision for doubful debt Foreign exchange gain Total expenses Surplus of income over expenses before tax Income tax expense Surplus of income over expenses for the year Oeher comprehensive income Total comprehensive income for the year Basic earnings per share 16 17 (2.546 300) 2.331832) (263,801) (29,773) 5.608 (5,166,098) 2,027 349 (294.259) 1,733,090 (2456 983 (2.334.525 (280 200 (31 217 19.181 (5,083 744 2.081 74 (246 721 1.835 02 18 19 6.1 20 1,835 025 0.06 1,733,090 0.058Step by Step Solution
There are 3 Steps involved in it
Step: 1

Get Instant Access to Expert-Tailored Solutions
See step-by-step solutions with expert insights and AI powered tools for academic success
Step: 2

Step: 3

Ace Your Homework with AI
Get the answers you need in no time with our AI-driven, step-by-step assistance
Get Started


