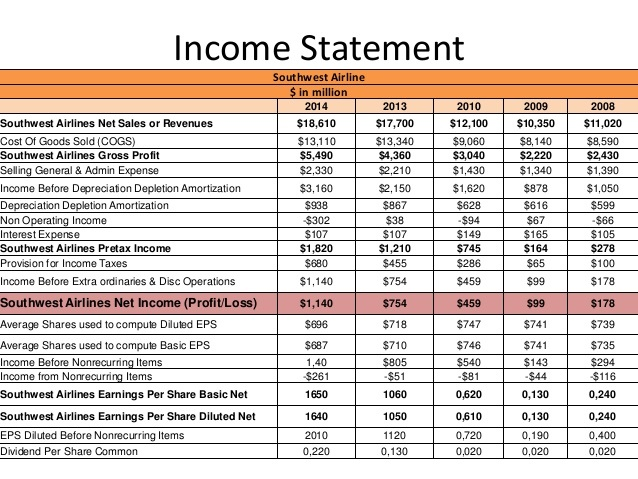
Question
Using the balance sheet and income statenent of Southwest Airlines from 2014-2015. Provide the following ratios you must show your work Net Profit Margin Current
Using the balance sheet and income statenent of Southwest Airlines from 2014-2015. Provide the following ratios
you must show your work
Net Profit Margin
Current Ratio
Debt Equity
Inventory Turnover or Price Earnings
Provide an explanation about the relevance of ratio as well as whether or not it is a strength or weakness

http://www.nasdaq.com/symbol/luv/financials?query=balance-sheet
 Income Statement Balance Sheet Cash Flow Financial Ratios Annual Income Statement (values in 000's) Get Quarterly Data Period Ending: Trend 12/31/2015 12/31/2014 12/31/2013 12/31/2012 Current Assets Cash and Cash Equivalents $1,583,000 $1,282,000 $1,355,000 $1,113,000 Short-Term Investments $1,468,000 $1,706,000 $1,797,000 $1,857,000 Net Receivables $474,000 $365,000 $587,000 $578,000 Inventory $311,000 $342,000 $467,000 $469,000 Other Current Assets $188,000 $232,000 $250,000 $210,000 Total Current Assets $4,024,000 $3,927,000 $4,456,000 $4,227,000 Long-Term Assets Long-Term Investments $0 $0 $0 $0 Fixed Assets $15,601,000 $14,292,000 $13,389,000 $12,766,000 Goodwill $970,000 $970,000 $970,000 $970,000 Intangible Assets $0 $0 $0 $0 Other Assets $717,000 $534,000 $530,000 $633,000 Deferred Asset Charges $0 $0 $0 $0 Total Assets $21,312,000 $19,723,000 $19,345,000 $18,596,000 Current Liabilities Accounts Payable $3,779,000 $2,768,000 $2,476,000 $2,209,000 Short-Term Debt / Current Portion of Long-Term Debt $637,000 $258,000 $629,000 $271,000 Other Current Liabilities $2,990,000 $2,897,000 $2,571,000 $2,170,000 Total Current Liabilities $7,406,000 $5,923,000 $5,676,000 $4,650,000 Long-Term Debt $2,541,000 $2,434,000 $2,191,000 $2,883,000 Other Liabilities $1,517,000 $1,809,000 $1,208,000 $1,187,000 Deferred Liability Charges $2,490,000 $2,782,000 $2,934,000 $2,884,000 Misc. Stocks $0 $0 $0 $0 Minority Interest $0 $0 $0 $0 Total Liabilities $13,954,000 $12,948,000 $12,009,000 $11,604,000 Stock Holders Equity Common Stocks $808,000 $808,000 $808,000 $808,000 Capital Surplus $1,374,000 $1,315,000 $1,231,000 $1,210,000 Retained Earnings $9,409,000 $7,416,000 $6,431,000 $5,768,000 Treasury Stock ($3,182,000) ($2,026,000) ($1,131,000) ($675,000) Other Equity ($1,051,000) ($738,000) ($3,000) ($119,000) Total Equity $7,358,000 $6,775,000 $7,336,000 $6,992,000 Total Liabilities & Equity $21,312,000 $19,723,000 $19,345,000 $18,596,000 See a: Company Financials data entry page Read more: http://www.nasdaq.com/symbol/luv/financials?query=balance-sheet#ixzz45fiv5
Step by Step Solution
There are 3 Steps involved in it
Step: 1

Get Instant Access to Expert-Tailored Solutions
See step-by-step solutions with expert insights and AI powered tools for academic success
Step: 2

Step: 3
Ace Your Homework with AI
Get the answers you need in no time with our AI-driven, step-by-step assistance
Get Started