Answered step by step
Verified Expert Solution
Question
1 Approved Answer
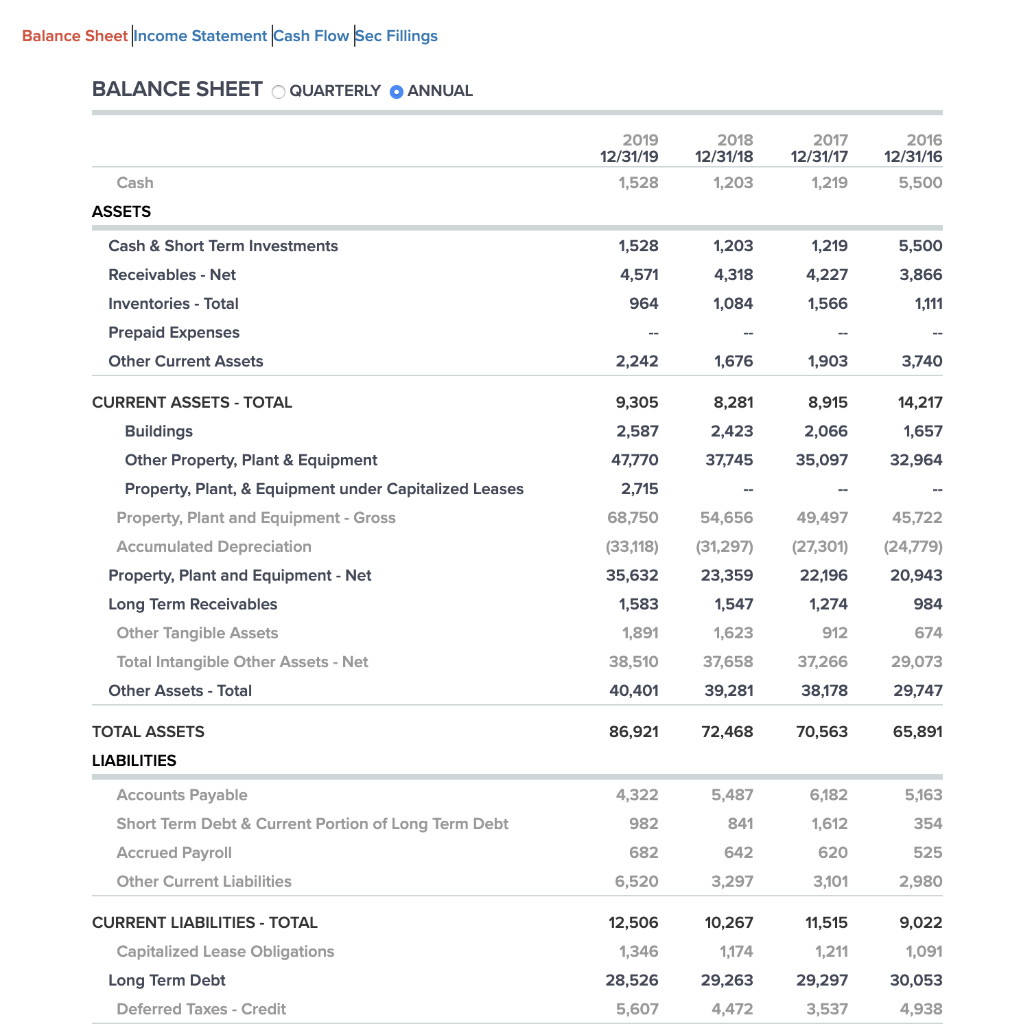
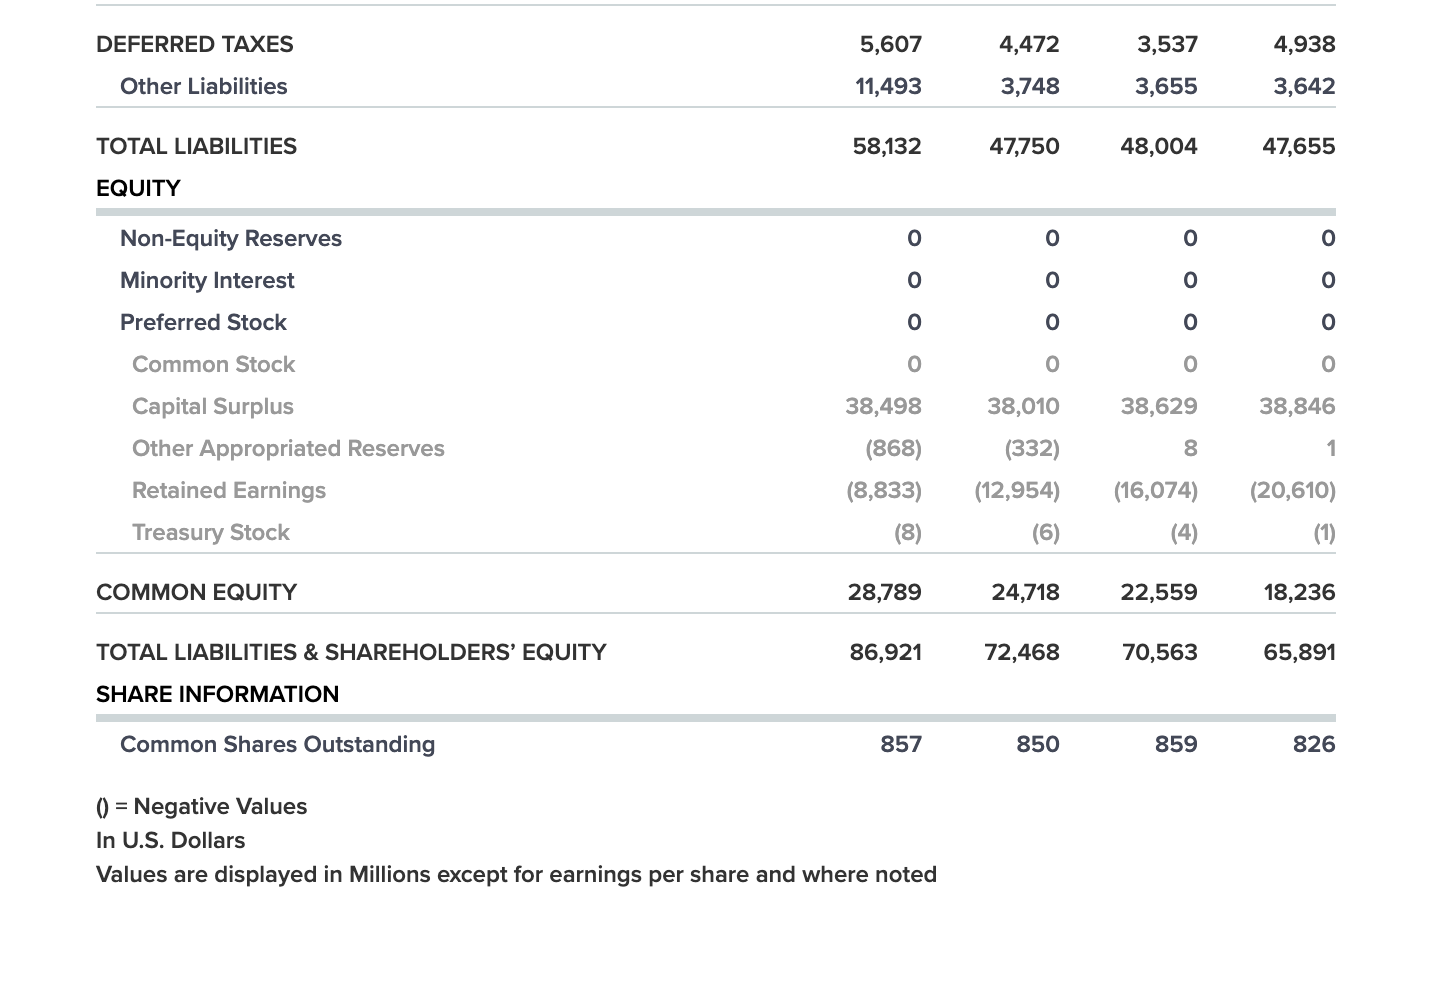
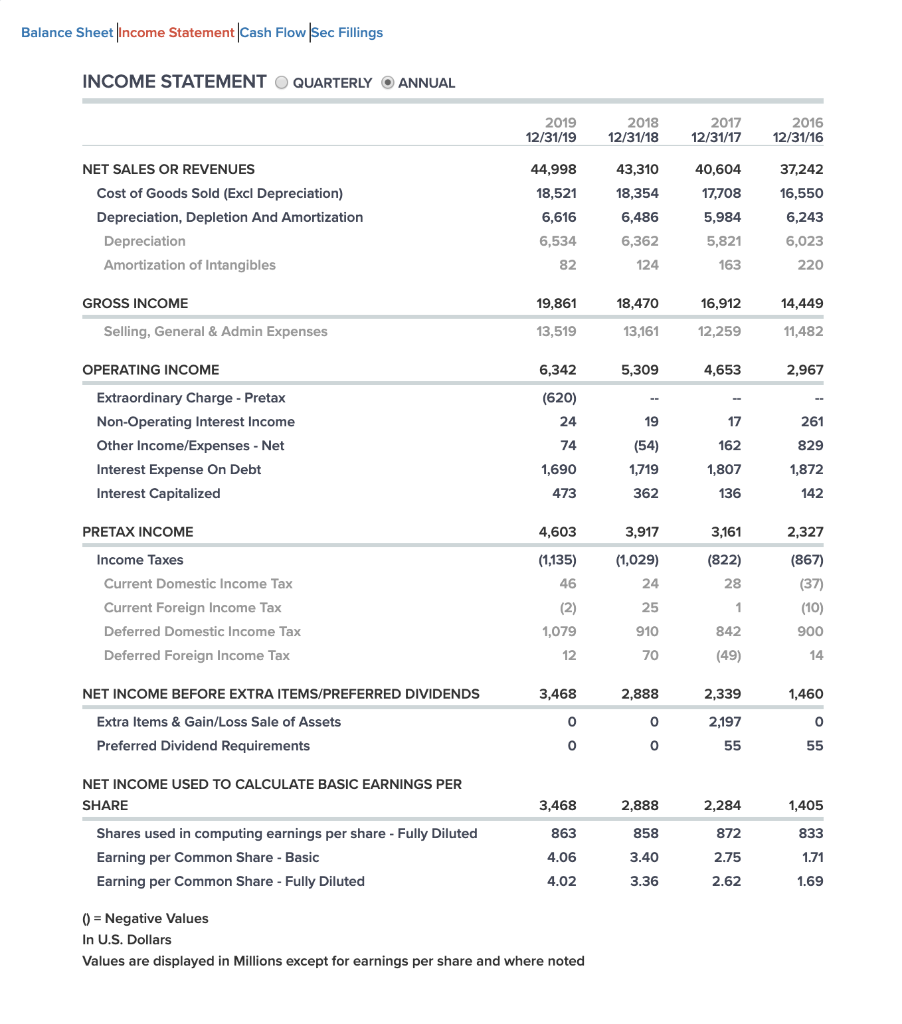
Using the Balance sheet, Income Statement, and Warren Buffet Ratio. Answer the following, Show all calculation Please: Have sales increased continuously for 3 years? Yes


Using the Balance sheet, Income Statement, and Warren Buffet Ratio. Answer the following, Show all calculation Please:
| Yes | No |
| Yes | No |
| Yes | No |
| Yes | No |
| Yes | No |
| Yes | No |
| Yes | No |
| Yes | No |
| Yes | No |
| Yes | No |
| Yes | No |
| Yes | No |
| Yes | No |
|
|
|
Balance Sheet Income Statement Cash Flow Sec Fillings BALANCE SHEET QUARTERLY O ANNUAL 2019 12/31/19 1,528 2018 1 2/31/18 1,203 2017 2016 12/31/17 12/31/16 1,2195 ,500 Cash ASSETS Cash & Short Term Investments Receivables - Net Inventories - Total Prepaid Expenses Other Current Assets 1,528 4,571 964 1,203 4,318 1,084 1,219 4,227 1,566 5,500 3,866 1,111 2,242 1,676 1,903 3,740 8,281 2,423 37,745 8,915 2,066 35,097 14,217 1,657 32,964 CURRENT ASSETS - TOTAL Buildings Other Property, Plant & Equipment Property, Plant, & Equipment under Capitalized Leases Property, Plant and Equipment - Gross Accumulated Depreciation Property, Plant and Equipment - Net Long Term Receivables Other Tangible Assets Total Intangible Other Assets - Net Other Assets - Total 9,305 2,587 47,770 2,715 68,750 (33,118) 35,632 1,583 1,891 38,510 40,401 45,722 (24,779) 20,943 54,656 (31,297) 23,359 1,547 1,623 37,658 39,281 49,497 (27,301) 22,196 1,274 912 37,266 38,178 984 674 29,073 29,747 86,921 72,468 70,563 65,891 TOTAL ASSETS LIABILITIES 5,487 4,322 982 Accounts Payable Short Term Debt & Current Portion of Long Term Debt Accrued Payroll Other Current Liabilities 6,182 1,612 620 3,101 841 642 3,297 5,163 354 525 2,980 682 6,520 CURRENT LIABILITIES - TOTAL Capitalized Lease Obligations Long Term Debt Deferred Taxes - Credit 12,506 1,346 28,526 5,607 10,267 1,174 29,263 4,472 11,515 1,211 29,297 3,537 9,022 1,091 30,053 4,938 DEFERRED TAXES 5,607 3,537 4,938 4,472 3,748 Other Liabilities 11,493 3,655 3,642 TOTAL LIABILITIES 58,132 47,750 48,004 47,655 EQUITY o Non-Equity Reserves Minority Interest Preferred Stock 0 0 0 0 0 0 0 0 0 0 0 0 Common Stock Capital Surplus 38,498 38,629 38,846 Other Appropriated Reserves 38,010 (332) (12,954) (6) (868) (8,833) (8) Retained Earnings (16,074) (20,610) (1) Treasury Stock (4) COMMON EQUITY 28,789 24,718 22,559 18,236 TOTAL LIABILITIES & SHAREHOLDERS' EQUITY 86,921 72,468 70,563 65,891 SHARE INFORMATION Common Shares Outstanding 857 850 859 859 826 826 () = Negative Values In U.S. Dollars Values are displayed in Millions except for earnings per share and where noted Balance Sheet |Income Statement|Cash Flow Sec Fillings INCOME STATEMENT O QUARTERLY O ANNUAL 2019 12/31/19 2018 12/31/18 2017 12/31/17 2016 12/31/16 NET SALES OR REVENUES Cost of Goods Sold (Excl Depreciation) Depreciation, Depletion And Amortization Depreciation Amortization of Intangibles 44,998 18,521 6,616 6,534 43,310 18,354 6,486 6,362 124 40,604 17,708 5,984 5,821 163 37,242 16,550 6,243 6,023 82 220 GROSS INCOME 10, 19,861 13,519 18,470 13,161 16,912 12,259 14,449 11,482 Selling, General & Admin Expenses OPERATING INCOME 6,342 5,309 4,653 2,967 (620) 19 17 Extraordinary Charge - Pretax Non-Operating Interest Income Other Income/Expenses - Net Interest Expense On Debt Interest Capitalized 162 24 74 1,690 473 (54) 1,719 362 261 829 1,872 142 1,807 136 PRETAX INCOME 3,161 4,603 (1,135) 46 3,917 (1,029) 24 Income Taxes Current Domestic Income Tax Current Foreign Income Tax Deferred Domestic Income Tax Deferred Foreign Income Tax (822) 28 1 2,327 (867) (37) (10) 900 14 (2) 1,079 25 910 70 842 (49) NET INCOME BEFORE EXTRA ITEMS/PREFERRED DIVIDENDS 3,468 2,888 2,339 1,460 2,197 Extra Items & Gain/Loss Sale of Assets Preferred Dividend Requirements 55 3,468 NET INCOME USED TO CALCULATE BASIC EARNINGS PER SHARE Shares used in computing earnings per share - Fully Diluted Earning per Common Share - Basic Earning per Common Share - Fully Diluted 863 4.06 4.02 2,888 858 3.40 3.36 2,284 872 2.75 2.62 1,405 833 1.71 1.69 0 = Negative Values In U.S. Dollars Values are displayed in Millions except for earnings per share and where noted Balance Sheet Income Statement Cash Flow Sec Fillings BALANCE SHEET QUARTERLY O ANNUAL 2019 12/31/19 1,528 2018 1 2/31/18 1,203 2017 2016 12/31/17 12/31/16 1,2195 ,500 Cash ASSETS Cash & Short Term Investments Receivables - Net Inventories - Total Prepaid Expenses Other Current Assets 1,528 4,571 964 1,203 4,318 1,084 1,219 4,227 1,566 5,500 3,866 1,111 2,242 1,676 1,903 3,740 8,281 2,423 37,745 8,915 2,066 35,097 14,217 1,657 32,964 CURRENT ASSETS - TOTAL Buildings Other Property, Plant & Equipment Property, Plant, & Equipment under Capitalized Leases Property, Plant and Equipment - Gross Accumulated Depreciation Property, Plant and Equipment - Net Long Term Receivables Other Tangible Assets Total Intangible Other Assets - Net Other Assets - Total 9,305 2,587 47,770 2,715 68,750 (33,118) 35,632 1,583 1,891 38,510 40,401 45,722 (24,779) 20,943 54,656 (31,297) 23,359 1,547 1,623 37,658 39,281 49,497 (27,301) 22,196 1,274 912 37,266 38,178 984 674 29,073 29,747 86,921 72,468 70,563 65,891 TOTAL ASSETS LIABILITIES 5,487 4,322 982 Accounts Payable Short Term Debt & Current Portion of Long Term Debt Accrued Payroll Other Current Liabilities 6,182 1,612 620 3,101 841 642 3,297 5,163 354 525 2,980 682 6,520 CURRENT LIABILITIES - TOTAL Capitalized Lease Obligations Long Term Debt Deferred Taxes - Credit 12,506 1,346 28,526 5,607 10,267 1,174 29,263 4,472 11,515 1,211 29,297 3,537 9,022 1,091 30,053 4,938 DEFERRED TAXES 5,607 3,537 4,938 4,472 3,748 Other Liabilities 11,493 3,655 3,642 TOTAL LIABILITIES 58,132 47,750 48,004 47,655 EQUITY o Non-Equity Reserves Minority Interest Preferred Stock 0 0 0 0 0 0 0 0 0 0 0 0 Common Stock Capital Surplus 38,498 38,629 38,846 Other Appropriated Reserves 38,010 (332) (12,954) (6) (868) (8,833) (8) Retained Earnings (16,074) (20,610) (1) Treasury Stock (4) COMMON EQUITY 28,789 24,718 22,559 18,236 TOTAL LIABILITIES & SHAREHOLDERS' EQUITY 86,921 72,468 70,563 65,891 SHARE INFORMATION Common Shares Outstanding 857 850 859 859 826 826 () = Negative Values In U.S. Dollars Values are displayed in Millions except for earnings per share and where noted Balance Sheet |Income Statement|Cash Flow Sec Fillings INCOME STATEMENT O QUARTERLY O ANNUAL 2019 12/31/19 2018 12/31/18 2017 12/31/17 2016 12/31/16 NET SALES OR REVENUES Cost of Goods Sold (Excl Depreciation) Depreciation, Depletion And Amortization Depreciation Amortization of Intangibles 44,998 18,521 6,616 6,534 43,310 18,354 6,486 6,362 124 40,604 17,708 5,984 5,821 163 37,242 16,550 6,243 6,023 82 220 GROSS INCOME 10, 19,861 13,519 18,470 13,161 16,912 12,259 14,449 11,482 Selling, General & Admin Expenses OPERATING INCOME 6,342 5,309 4,653 2,967 (620) 19 17 Extraordinary Charge - Pretax Non-Operating Interest Income Other Income/Expenses - Net Interest Expense On Debt Interest Capitalized 162 24 74 1,690 473 (54) 1,719 362 261 829 1,872 142 1,807 136 PRETAX INCOME 3,161 4,603 (1,135) 46 3,917 (1,029) 24 Income Taxes Current Domestic Income Tax Current Foreign Income Tax Deferred Domestic Income Tax Deferred Foreign Income Tax (822) 28 1 2,327 (867) (37) (10) 900 14 (2) 1,079 25 910 70 842 (49) NET INCOME BEFORE EXTRA ITEMS/PREFERRED DIVIDENDS 3,468 2,888 2,339 1,460 2,197 Extra Items & Gain/Loss Sale of Assets Preferred Dividend Requirements 55 3,468 NET INCOME USED TO CALCULATE BASIC EARNINGS PER SHARE Shares used in computing earnings per share - Fully Diluted Earning per Common Share - Basic Earning per Common Share - Fully Diluted 863 4.06 4.02 2,888 858 3.40 3.36 2,284 872 2.75 2.62 1,405 833 1.71 1.69 0 = Negative Values In U.S. Dollars Values are displayed in Millions except for earnings per share and where noted
Step by Step Solution
There are 3 Steps involved in it
Step: 1

Get Instant Access to Expert-Tailored Solutions
See step-by-step solutions with expert insights and AI powered tools for academic success
Step: 2

Step: 3

Ace Your Homework with AI
Get the answers you need in no time with our AI-driven, step-by-step assistance
Get Started


