

Answered step by step
Verified Expert Solution
Question
1 Approved Answer
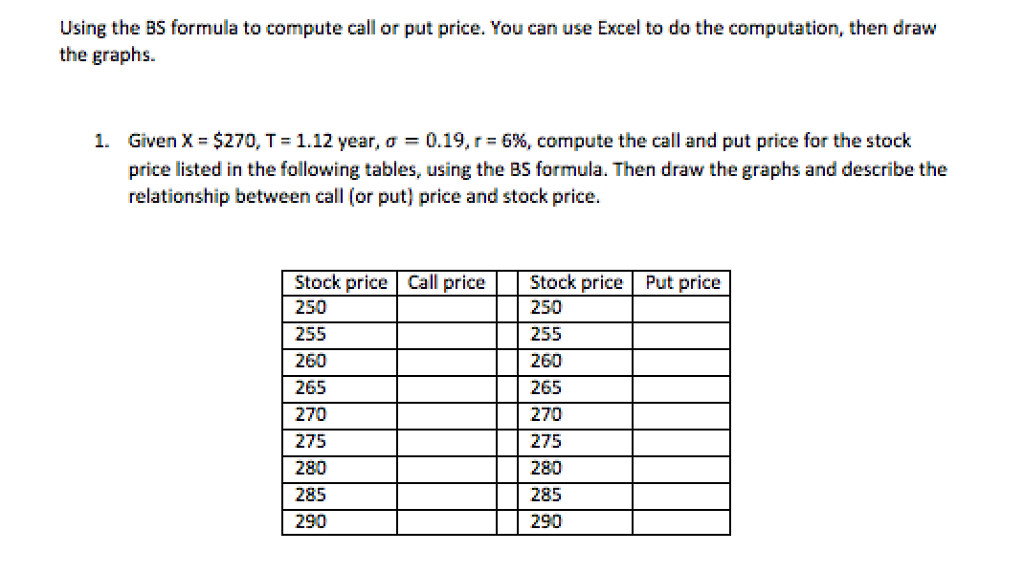
Using the BS formula to compute call or put price. You can use Excel to do the computation, then draw the graphs Given X =
Step by Step Solution
There are 3 Steps involved in it
Step: 1

Get Instant Access to Expert-Tailored Solutions
See step-by-step solutions with expert insights and AI powered tools for academic success
Step: 2

Step: 3
Ace Your Homework with AI
Get the answers you need in no time with our AI-driven, step-by-step assistance
Get Started
The Laymans Guide To Managing Your Investments
Authors: Thomas Dunleavy
1st Edition
979-8763592214