

Question
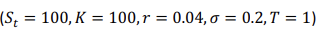
Using the BSM formula, illustrate how the price of the Calloption (Which is the photo) varies with the remaining maturity (T-t). Examine the VIX Index
Using the BSM formula, illustrate how the price of the Calloption (Which is the photo) varies with the remaining maturity (T-t).
Examine the VIX Index (included: VIX Index Calculation Method, VIX Index Graph)
**
Please solve it, and please show it in a graph on Excel or something program!
Step by Step Solution
There are 3 Steps involved in it
Step: 1

Get Instant Access to Expert-Tailored Solutions
See step-by-step solutions with expert insights and AI powered tools for academic success
Step: 2

Step: 3
Ace Your Homework with AI
Get the answers you need in no time with our AI-driven, step-by-step assistance
Get Started
Theory Of Constraints Handbook
Authors: James Cox, John Schleier
1st Edition
0071665544, 978-0071665544