Answered step by step
Verified Expert Solution
Question
1 Approved Answer
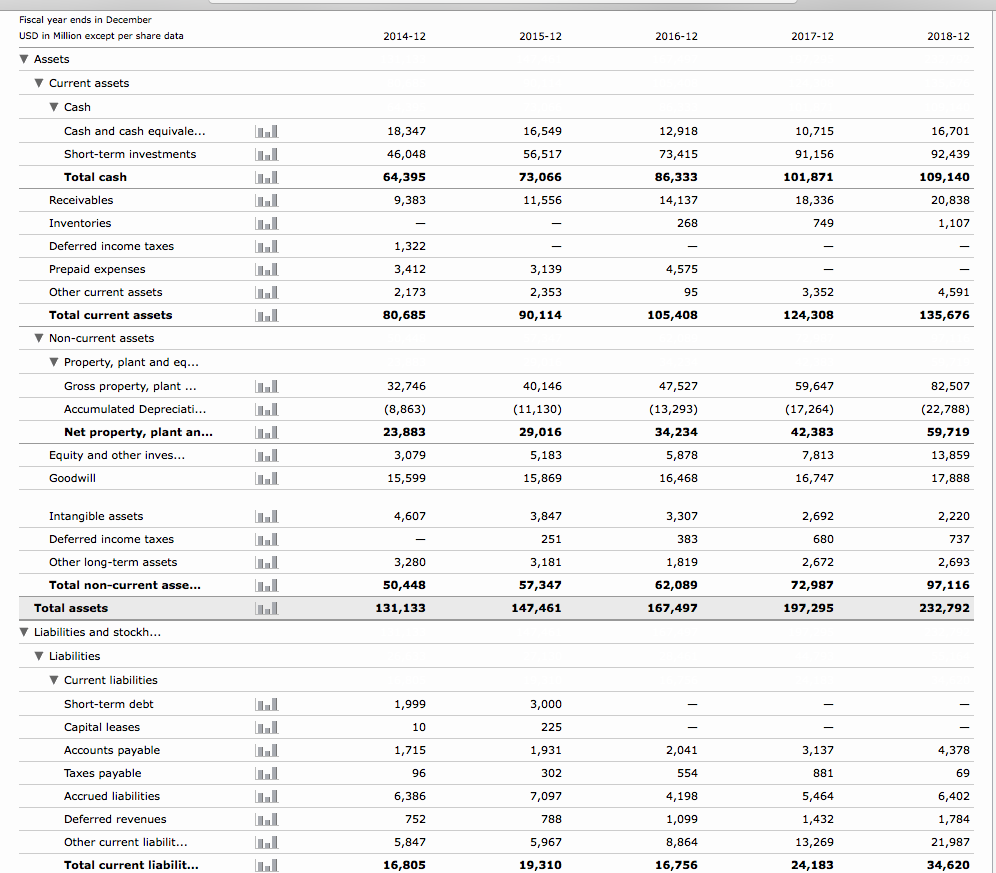
Using the data above, please calculate Google's Long Term Assets as % of Total Assets. (Net Property, Plant and Equipment) Fiscal year ends in December


Using the data above, please calculate Google's Long Term Assets as % of Total Assets.
(Net Property, Plant and Equipment)
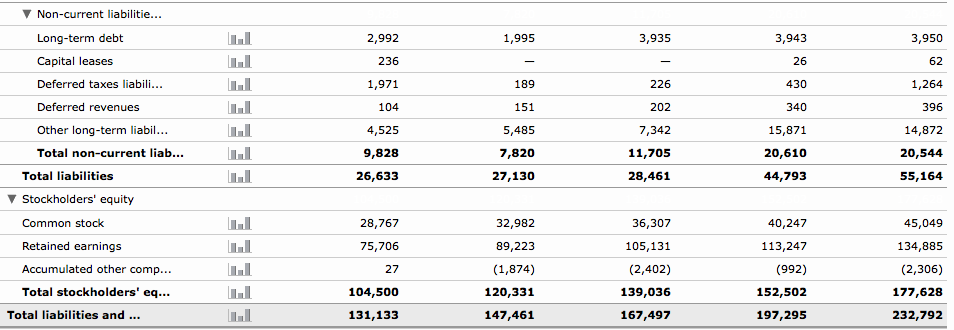
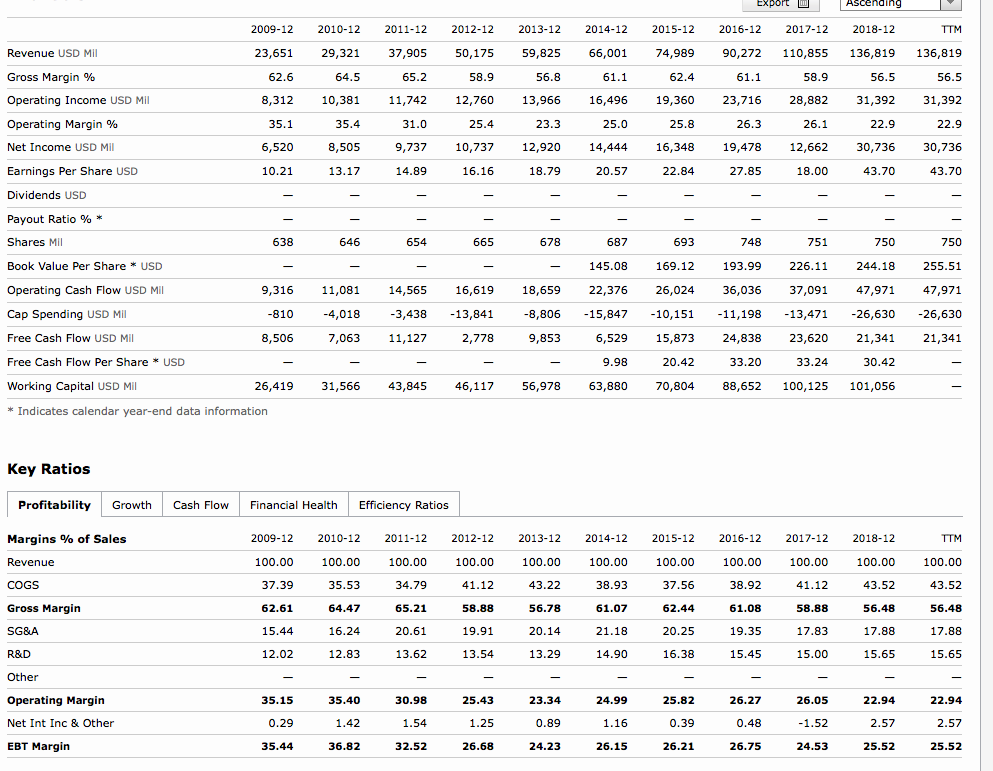
Fiscal year ends in December USD in Million except per share data 2014-12 2015-12 2016-12 2017-12 2018-12 Assets Current assets 18,347 46,048 64,395 16,549 56,517 73,066 11,556 Cash and cash equivale... Short-term investments Total cash 12,918 10,715 91,156 101,871 16,701 92,439 109,140 20,838 1,107 86,333 14,137 268 Receivables 749 ories Deferred income taxes Prepaid expenses Other current assets Total current assets Non-current assets 4,575 4,591 90,114 80,685 105,408 124,308 135,676 Property, plant and eq. Gross property, plant Accumulated Depreciati... Net property, plant an... 59,647 (17,264) 42,383 32,746 (8,863) 23,883 47,527 (13,293) 34,234 5,878 16,468 82,507 (22,788) 59,719 13,859 17,888 40,146 29,016 5,183 15,869 Equity and other inves... 15,599 16,747 Intangible a Deferred income taxes Other long-term assets Total non-current asse... 3,847 3,307 2,692 680 2,672 72,987 197,295 4,607 3,280 50,448 131,133 3,181 57,347 147,461 62,089 Total assets 167,497 232,792 Liabilities and stockh Liabilities Current liabilities Short-term debt Capital leases Accounts payable Taxes payable Accrued liabilities 1,931 3,137 881 96 7,097 788 5,967 19,310 6,402 4,198 Deferred revenues 13,269 24,183 21,987 Other current liabilit... 5,847 16,756 Total current liabilit... 16,805 34,620 Non-current liabilitie Long-term debt Capital leases Deferred taxes liabili.. Deferred revenues Other long-term liabi Total non-current liab 2,992 236 1,971 104 4,525 9,828 26,633 3,950 62 1,264 396 14,872 20,544 55,164 3,943 26 430 340 15,871 20,610 44,793 1,995 3,935 189 151 5,485 7,820 27,130 226 202 7,342 11,705 28,461 Total liabilities Stockholders' equity Common stock Retained earnings Accumulated other comp. Total stockholders' eq... 40,247 113,247 (992) 152,502 197,295 28,767 75,706 27 104,500 131,133 36,307 105,131 (2,402) 139,036 167,497 32,982 89,223 (1,874) 120,331 147,461 45,049 134,885 (2,306) 177,628 232,792 Total liabilities and export 2009-12 2010-12 2011-12 2012-122013-12 2014-12 2015-12 2016-12 2017-12 2018-12 TTM Revenue USD Mil Gross Margin % Operating Income USD Mil Operating Margin % Net Income USD Mil Earnings Per Share USD Dividends USD Payout Ratio 96 * Shares Mil Book Value Per Share USD Operating Cash Flow USD Mil Cap Spending USD Mil Free Cash Flow USD Mil Free Cash Flow Per Share* USD Working Capital USD Mil 23,651 29,321 37,905 50,175 59,825 66,001 74,98990,272 110,855 136,819 136,819 8,312 10,381 11,74212,760 13,966 16,496 19,360 23,71628,882 31,392 31,392 6,520 8,505 9,737 10,737 12,920 14,444 16,348 19,478 12,662 30,736 30,736 14.89 20.57 22.84 27.85 665 638 654 678 687 693 748 751 _-145.08 169.12 193.99 226.11 244.18 255.51 9,316 11,081 14,565 16,619 18,659 22,376 26,024 36,03637,091 47,971 47,971 8,806 -15,847 10,151 -11,19813,471-26,630 26,630 6,529 15,873 24,838 23,620 21,341 21,341 810 4,0183,438 -13,841 7,063 11,127 8,506 2,778 33.24 26,419 31,566 43,845 46,117 56,978 63,880 70,80488,652 100,125 101,056 Indicates calendar year-end data information Key Ratios Profitability GrowthCash Flow Financial Health Efficiency Ratios Margins % of Sales Revenue COGS Gross Margin SG&A R&D 2009-12 2010-12 2011-12 2012-122013-12 2014-12 2015-12 2016-12 2017-12 2018-12 TTM 100.00 100.00 100.00 100.00 100.00 100.00 100.00 100.00 100.00 100.00 100.00 34.79 62.61 65.21 58.88 56.48 17.88 15.65 56.48 64.47 56.78 61.07 62.44 20.25 16.38 61.08 58.88 16.24 19.91 12.02 15.00 15.65 Operating Margin Net Int Inc & Other EBT Margin 25.43 23.34 24.99 26.27 22.94 22.94 35.15 35.40 30.98 25.82 26.05 35.44 36.82 32.52 26.68 24.23 26.15 26.21 26.75 24.53 25.52 25.52 Profitability Tax Rate % Net Margin % Asset Turnover (Average) Return on Assets % Financial Leverage (Average) Re 2009-12 2010-12 2011-12 2012-122013-12 2014-12 2015-12 2016-12 2017-12 2018-12 11.96 22.46 0.64 14.29 1.31 18.62 17.26 TTM 11.96 22.46 0.64 14.29 1.31 18.62 17.26 -213.52 160.36 175.65 171.88 189.95 195.76 250.48 307.25 307.25 21.00 25.69 0.58 14.93 1.25 18.66 15.89 19.30 21.88 0.55 11.93 1.25 15.06 13.77 19.35 21.58 0.57 12.37 1.20 15.02 14.02 53.44 11.42 0.61 6.94 1.29 8.69 8.08 22.20 27.57 0.65 18.05 1.12 20.30 19.74 21.22 29.01 0.60 17.30 1.25 20.68 18.05 19.41 21.40 0.60 12.91 1.31 16.54 14.66 15.74 21.60 0.58 12.62 1.27 16.25 14.52 16.81 21.10 0.54 11.36 1.23 14.08 12.82 turn on Equity % Return on Invested Capital % Interest CoverageStep by Step Solution
There are 3 Steps involved in it
Step: 1

Get Instant Access to Expert-Tailored Solutions
See step-by-step solutions with expert insights and AI powered tools for academic success
Step: 2

Step: 3

Ace Your Homework with AI
Get the answers you need in no time with our AI-driven, step-by-step assistance
Get Started


