Answered step by step
Verified Expert Solution
Question
1 Approved Answer
Using the data above, please calculate Walmarts Long Term Assets as % of Total Assets 2018. Calculate Walmart Accumulated Depreciation on Long Term Assets 2018.
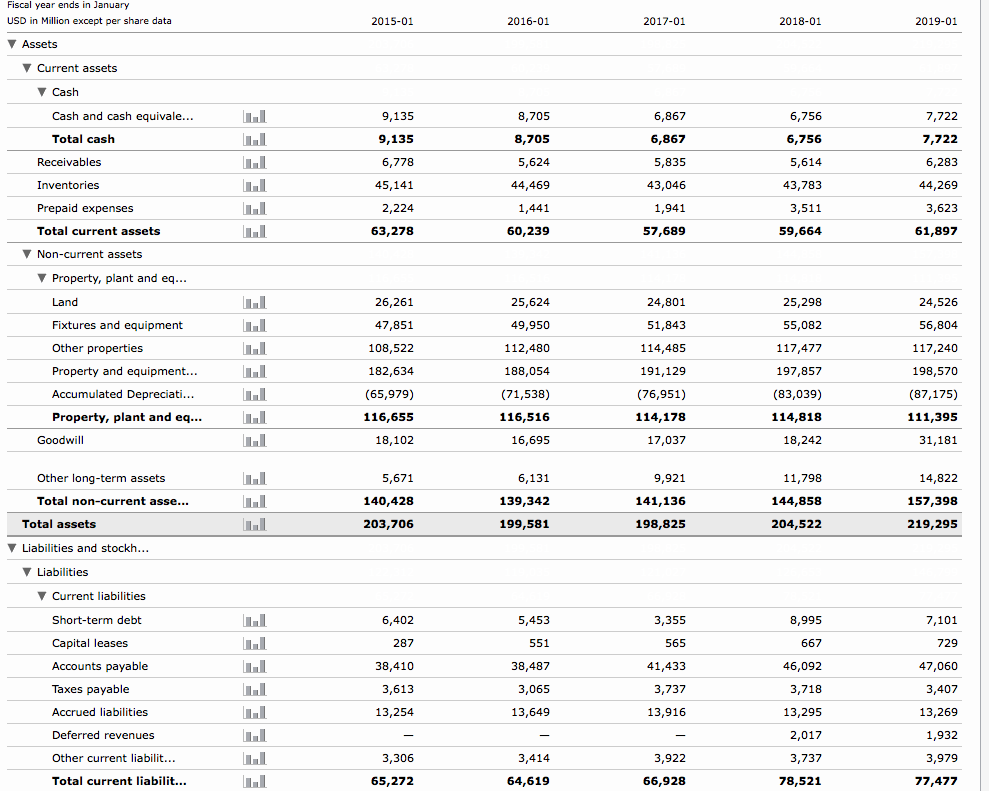
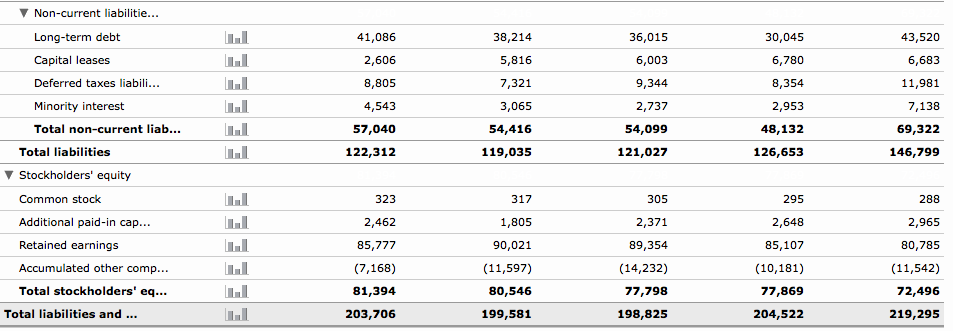
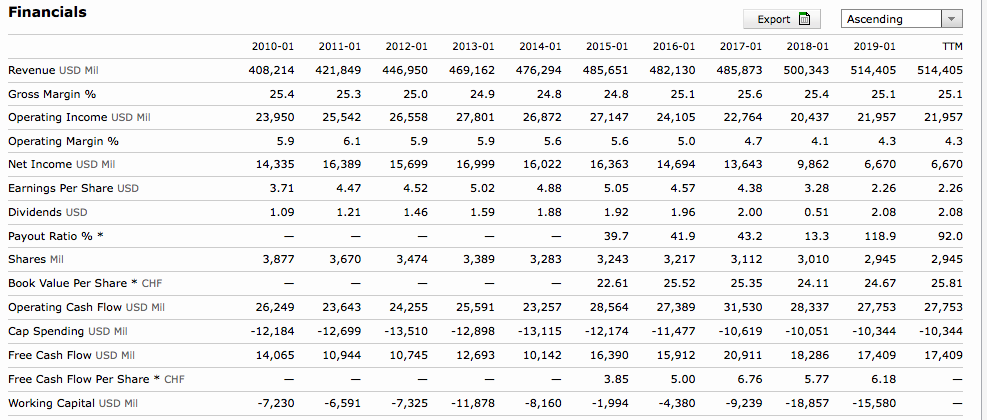
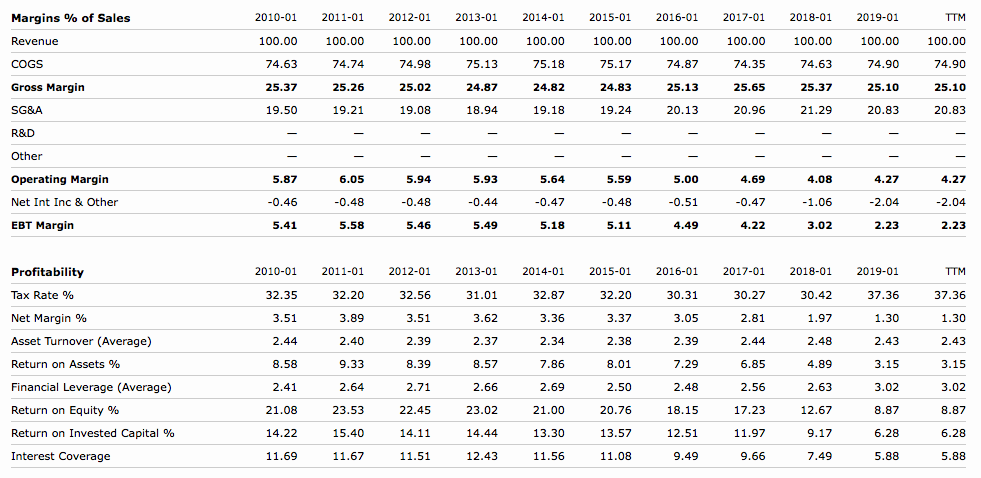
Using the data above, please calculate Walmarts Long Term Assets as % of Total Assets 2018.
Calculate Walmart Accumulated Depreciation on Long Term Assets 2018.
(Net Property, Plant and Equipment)
Fiscal year e USD in Million except per share data nds in January 2015-01 2016-01 2017-01 2018-01 2019-01 Assets Current assets 8,705 Cash and cash equivale... 6,867 6,756 9,135 6,778 45,141 8,705 6,867 Total cash Receivables Inventories Prepaid expenses Total current assets Non-current assets 6,756 7,722 44,269 3,623 61,897 43,046 43,783 3,511 59,664 44,469 63,278 57,689 60,239 Property, plant and eq. 25,624 49,950 112,480 188,054 (71,538) 116,516 16,695 24,526 56,804 117,240 198,570 (87,175) 111,395 31,181 26,261 47,851 108,522 182,634 (65,979) 116,655 18,102 24,801 51,843 114,485 191,129 (76,951) 114,178 17,037 25,298 55,082 117,477 197,857 (83,039) 114,818 18,242 Fixtures and equipment Other properties Property and equipment... Accumulated Depreciati... Property, plant and eq... 9,921 141,136 198,825 11,798 144,858 204,522 Other long-term assets 5,671 140,428 203,706 Total non-current asse... 139,342 157,398 Total assets 199,581 219,295 Liabilities and stockh Liabilities Current liabilities Short-term debt Capital leases Accounts payable Taxes payable Accrued liabilities 6,402 667 729 38,487 3,065 13,649 41,433 46,092 47,060 3,737 13,295 13,254 13,269 Deferred revenues 3,414 3,737 Other current liabilit... 65,272 64,619 66,928 78,521 Total current liabilit... 77,477 Non-current liabilitie Long-term debt Capital leases Deferred taxes liabili. Minority interest Total non-current liab 36,015 6,003 9,344 2,737 54,099 121,027 30,045 6,780 8,354 2,953 48,132 126,653 43,520 6,683 11,981 7,138 69,322 146,799 41,086 2,606 8,805 4,543 57,040 122,312 38,214 5,816 7,321 3,065 54,416 119,035 Total liabilities Stockholders' equity 323 2,462 85,777 (7,168) 81,394 203,706 305 2,371 89,354 (14,232) 77,798 198,825 295 2,648 85,107 (10,181) 77,869 204,522 Common stock Additional paid-in cap... Retained earnings Accumulated other comp. Total stockholders' eq... 317 1,805 90,021 (11,597) 80,546 199,581 288 2,965 80,785 (11,542) 72,496 219,295 Total liabilities and Financials ExportAscending TTM 408,214 421,849 446,950 469,162 476,294 485,651 482,130 485,873 500,343 514,405 514,405 25.1 23,950 25,542 26,558 27,801 26,872 27,147 24,10522,764 20,43721,95721,957 2010-01 2011-01 2012-01 2013-01 2014-01 2015-01 2016-01 2017-01 2018-01 2019-01 Revenue USD Mil Gross Margin % Operating Income USD Mil Operating Margin % Net Income USD MI Earnings Per Share USD Dividends USD Payout Ratio%* Shares Mil Book Value Per Share CHF Operating Cash Flow USD Mi Cap Spending USD Mil Free Cash Flow USD Mil Free Cash Flow Per Share CHF Working Capital USD Mil 25.4 25.3 25.0 24.9 24.8 25.1 25.6 25.4 25.1 4.7 14,335 16,389 15,699 16,999 16,022 16,363 14,69413,643 4.38 2.00 43.2 3,112 25.35 5.9 5.9 5.9 5.6 5.6 5.0 9,862 3.28 0.51 13.3 3,010 24.11 6,670 2.26 2.08 118.9 2,945 24.67 6,670 2.26 2.08 92.0 2,945 25.81 26,249 23,643 24,255 25,591 23,257 28,564 27,389 31,530 28,337 27,753 27,753 -12,18412,699 13,510 -12,898 13,115 -12,17411,477 -10,619 10,051 -10,34410,344 14,065 10,944 10,745 12,693 10,142 16,390 15,91220,911 18,286 17,409 17,409 4.88 3.71 4.47 4.52 5.02 5.05 1.92 39.7 3,243 22.61 4.57 1.96 41.9 3,217 25.52 1.09 1.21 1.46 1.59 1.88 3,877 3,474 3,283 3,670 3,389 3.85 5.00 6.76 5.77 6.18 8,160 -1,994 7,230 -6,591-7,325 -11,878 9,239 -18,857-15,580 -4,380 Margins % of Sales Revenue COGS Gross Margin SG&A R&D 2010-01 2011-01 2012-01 2013-01 2014-01 2015-01 2016-01 2017-01 2018-01 2019-01 TTM 100.00 100.00 100.00 100.00 100.00 100.00 100.00 100.00 100.00 100.00 100.00 74.90 25.10 20.83 75.13 24.87 18.94 75.18 74.87 25.13 20.13 74.98 25.02 19.08 75.17 24.83 19.24 25.26 25.37 25.10 25.37 24.82 25.65 21.29 19.50 19.21 20.96 20.83 5.94 Operating Margin Net Int Inc & Other EBT Margin 5.87 6.05 5.93 5.64 5.59 5.00 4.69 4.08 4.27 4.27 5.41 5.58 5.49 4.49 4.22 3.02 2.23 2.23 5.46 Profitability Tax Rate % Net Margin % Asset Turnover (Average) Return on Assets % Financial Leverage (Average) Return on Equity % Return on Invested Capital % Interest Coverage 2010-01 2011-01 2012-01 2013-01 2014-01 2015-01 2016-01 2017-01 2018-01 2019-01 TTM 32.20 32.35 32.20 32.56 31.01 32.87 3.36 2.34 30.27 30.42 3.37 1.97 2.37 9.33 6.85 4.89 3.02 3.02 21.08 20.76 13.57 11.08 23.53 15.40 11.67 22.45 23.02 21.00 18.15 17.23 12.67 8.87 8.87 14.22 14.44 12.51 11.51Step by Step Solution
There are 3 Steps involved in it
Step: 1

Get Instant Access to Expert-Tailored Solutions
See step-by-step solutions with expert insights and AI powered tools for academic success
Step: 2

Step: 3

Ace Your Homework with AI
Get the answers you need in no time with our AI-driven, step-by-step assistance
Get Started


