using the data find current ratio, quick ratio, return on investment, return on assets, gross margin, earning per share, par value of stock, dividend policy. show your work
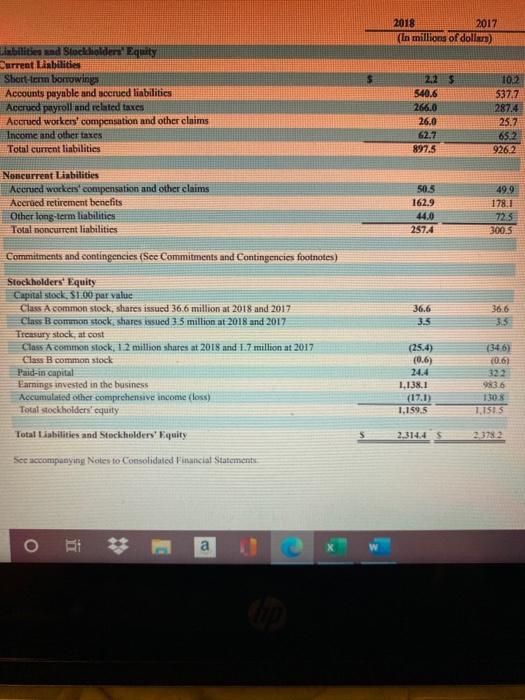
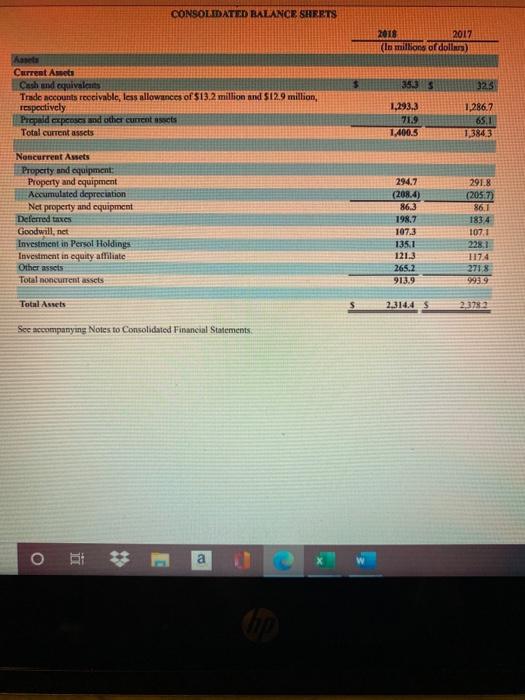
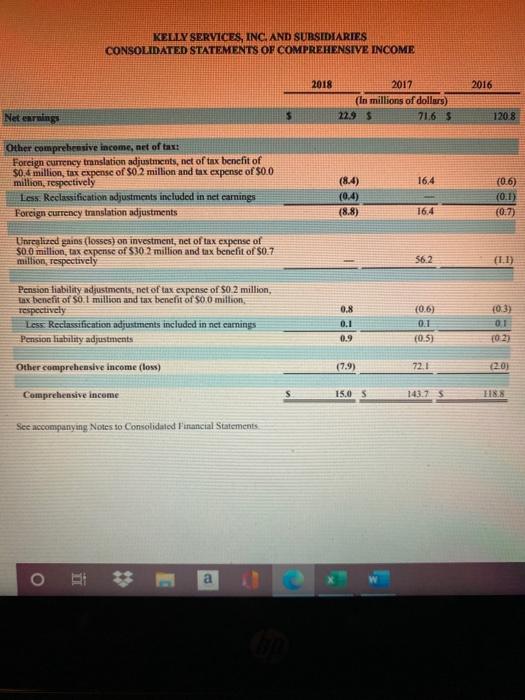
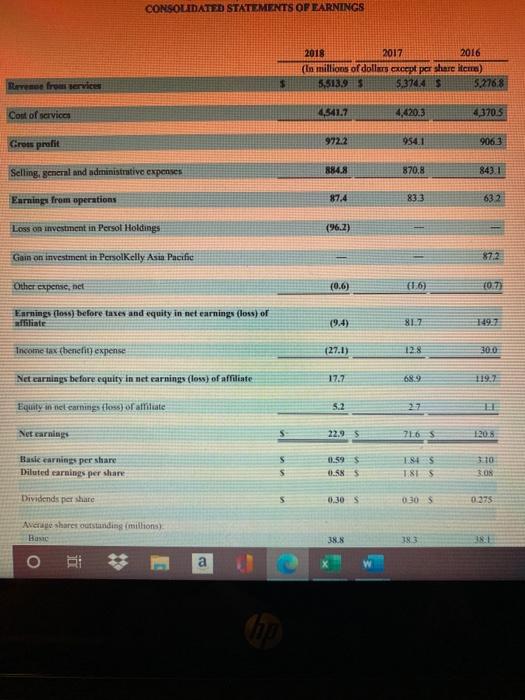
2018 2017 (In millions of dollars) Elabilities and Stocilders Equity Current Liabilitia Short-tenn borrowings Accounts payable and accrued liabilities Accrued payroll and related taxes Accrued workers' compensation and other claims Income and other taxes Totul current linbilities 2.25 540.6 266.0 26.0 62.7 897.5 102 537.7 2874 25.7 65.2 9262 Noncurrent Liabilities Accrued workers' compensation and other claims Accrued retirement benefits Other long-term liabilities Total noncurrent liabilities 50.5 162.9 44.0 257.4 499 1781 725 300.5 36.6 36.6 3:5 Commitments and contingencies (Sec Commitments and Contingencies footnotes) Stockholders' Equity Capital stock, $1.00 par value Class A common stock, shares issued 36.6 million at 2018 and 2017 Class B common stock, shares issued 3.5 million at 2018 and 2017 Treasury stock, at cost Class A common stock, 1.2 million shures at 2018 and 1.7 million at 2017 Class B common stock Paid-in capital Earnings invested in the business Accumulated other comprehensive income foss) Total stockholders' equity (346) 0.67 (25.4) (0.6) 24.4 1.138.1 17.1) 1.159.5 9836 1.1515 Total Liabilities and Stockholders' Equity 2.314.45 23782 See accompanying Notes to Consolidated Financial Statements a CONSOLIDATED BALANCE SHEETS 2018 2017 In millions of dollar) $ 3535 323 Aasta Current Ameti Cash and equivalent Trade accounts rectivable, less allowances of $13.2 million and $12.9 million, respectively Propaald eepose and other current assets Total current assets 1.293.3 71.9 1,400.5 1,286.7 65.1 1,3843 Noncurrent Assets Property and equipment: Property and equipment Accumulated depreciation Net property and equipment Deferred taxes Goodwill, net Investment in Persol Holdings Investment in equity affiliate Other assets Total noncurrent assets 294.7 (208.4) 86.3 198.7 107.3 135.1 121.3 265.2 913.9 291.8 (2057) 86,1 1834 107,1 2283 117.4 271,8 993.9 Total Assets 2.314.4 5 2.3782 See accompanying Notes to Consolidated Financial Statements a KELLY SERVICES, INC. AND SUBSIDIARIES CONSOLIDATED STATEMENTS OF COMPREHENSIVE INCOME 2018 2016 2017 (in millions of dollars) 22.9 $ 71.65 Net earnings $ 120 8 Other comprehensive income, net of tax: Forcign currency translation adjustments, net of tax benefit of $0.4 million, tax expense of $0.2 million and tax expense of $0.0 million, respectively Less. Reclassification adjustments included in net earnings Foreign currency translation adjustments 164 (8.4) (0.4) (0.6) (0:1 (0.7) (88) 16.4 Unrealized gains (losses) on investment, net of tax expense of $0.0 million, tax expense of $30.2 million and tax benefit of $0.7 million, respectively 56.2 (1.1) Pension liability adjustments, net of tax expense of S02 million, tax benefit of $0.1 million and tax benefit of $0.0 million, respectively Less Reclassification adjustments included in net earnings Pension liability adjustments 0.8 0.1 0.9 (0.6) 0.1 (0.5) {0.3) 01 10:27 Other comprehensive income (loss) (7.9) 72.1 (2:0) Comprehensive income 15.05 143.75 EISS See accompanying Notes to Consolidated Financial Statements O a CONSOLIDATED STATEMENTS OF EARNINGS 2018 2017 2016 (in millions of dollars except par share itera) 5.513.95 5.37445 5.2768 Brene fra service $ Cost of services 4,541.7 4,420.3 4,370.5 Cross profit 9722 954.1 906.3 Selling, general and administrative expenses 884.8 870,8 843.1 87.4 833 Earnings from sperations 632 Loss on investment in Persol Holdings (962) Gam on investment in PersolKelly Asin Pacific 87.2 (0.6) 1.6) 10.73 Other expense, net Earnings (loss before taxes and equity in net earnings (loss of affiliate (9.4) 817 (27.1) 17.7 Tacome tax chenetit expense Net earnings before equity in net earnings (los) of affiliate Equity we cerning those of amate Net earnings 5.2 27 22.95 21.65 120.8 Basic earnings per share Diluted earnings per share 11.59 $ 0.58S 1845 T&T 3.10 TOR Dividends per share 0.30 0.30 0.375 Average shares outstanding millions). 383 381 o RI a