

Answered step by step
Verified Expert Solution
Question
1 Approved Answer
Using the data for Tuuka and Crew below, prepare 1) Balance sheet for fiscal year 2017 and 2018 2) Income Statement multiple step for fiscal
Using the data for Tuuka and Crew below, prepare 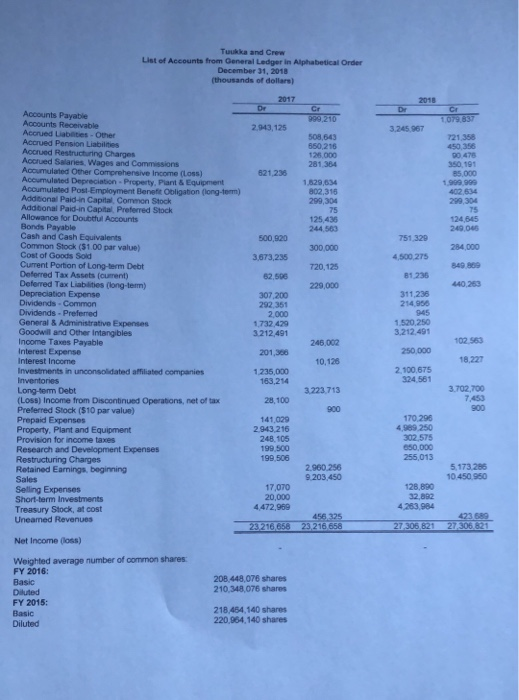
Tuukka and Crew List of Accounts from General Ledger in Alphabetical Order December 31, 2018 (thousands of dollars) 2017 2018 De Dr Cr 999 210 TOR2032 2.943,125 3.245.967 721,358 508,643 650,216 125.000 281,384 00.475 350 101 85.000 1 999 999 621,236 1,829,634 802,318 299,304 75 125,436 244,500 299, 304 75 124,645 249.00 500,920 751,320 300,000 284,000 3,673,235 4,500 275 720,125 849 809 62,500 81.235 229,000 440,263 311,235 214.56 Accounts Payable Accounts Receivable Accued Labeties Other Accrued Pension Liabilities Accrued Restructuring Charges Accued Salaries, Wages and Commissions Accumulated Other Comprehensive Income (Loss) Accumulated Depreciation - Property, Plant & Equipment Accumulated Post-Employment Benefit Obligation (long-term) Additional Paid in Capital, Common Stock Additional Paid-in Capital Preferred Stock Allowance for Doubtful Accounts Bonds Payable Cash and Cash Equivalents Common Stock ($1.00 par value) Cost of Goods Sold Current Portion of Long-term Debt Deferred Tax Assets (current) Deferred Tax Liabilities (long-term) Depreciation Expense Dividends - Common Dividends - Preferred General & Administrative Expenses Goodwill and Other Intangibles Income Taxes Payable Interest Expense Interest Income Investments in unconsolidated affiliated companies Inventories Long-term Debt (Loss) Income from Discontinued Operations, net of tax Preferred Stock ($10 par value) Prepaid Expenses Property. Plant and Equipment Provision for income taxes Research and Development Expenses Restructuring Charges Retained Earnings, beginning Sales Selling Expenses Short-term Investments Treasury Stock, at cost Uneamed Revenues 307,200 292351 2,000 1.732 429 3.212.491 1.520 250 3.212.491 246,002 102 563 201,350 250.000 10,128 18,227 1.235,000 163,214 2,100.675 324.561 3.223.713 3.702,700 28100 900 141,029 2.943.216 248,105 199,500 199,506 170.296 4.389 250 302.575 650.000 255,013 2.960.256 9.203.450 5.173.286 10.450 950 17,070 20,000 4.472.969 128,890 32,892 4.263,984 456,325 23,216 658 423 589 27 306, 821 23 216,656 27 306 821 Net Income (6) Weighted average number of common shares FY 2016: Basic Diluted FY 2015: Basic Diluted 208,448,076 shares 210,348,076 shares 218,454,140 shares 220,954.140 shares 1) Balance sheet for fiscal year 2017 and 2018
2) Income Statement multiple step for fiscal years 2017 and 2018
3) Statement of retained earnings for 2018
List 5 notes that would be required if you were also preparing the notes to these financial statements
Do not prepare the notes, just briefly list the accounts for which GAAP would require disclosure based on Tuukk's financial statements
Step by Step Solution
There are 3 Steps involved in it
Step: 1

Get Instant Access to Expert-Tailored Solutions
See step-by-step solutions with expert insights and AI powered tools for academic success
Step: 2

Step: 3
Ace Your Homework with AI
Get the answers you need in no time with our AI-driven, step-by-step assistance
Get Started
New Horizons In The Field Of Management Audit As A Tool For Improving The Overall Management Of Enterprises A Guideline For Good Governance
Authors: Mohammed Sakhawat Hossain
1st Edition
3639194454, 978-3639194456