

Question
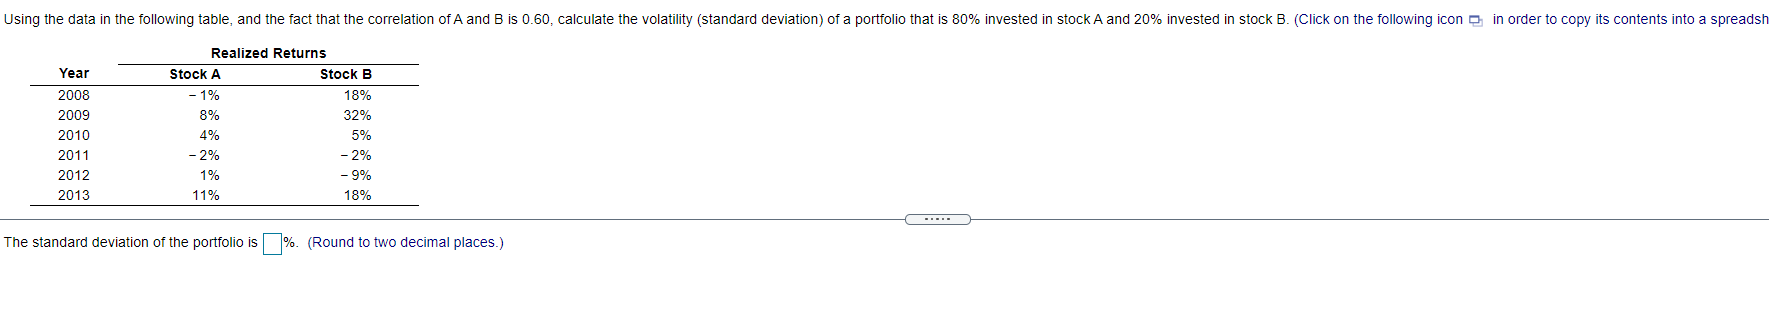
Using the data in the following table, and the fact that the correlation of A and B is 0.60, calculate the volatility (standard deviation) of
Using the data in the following table, and the fact that the correlation of A and B is
0.60,
calculate the volatility (standard deviation) of a portfolio that is
80%
invested in stock A and
20%
invested in stock B. (Click on the following icon
in order to copy its contents into a spreadsheet.)
| Realized Returns | ||||
| Year | Stock A | Stock B | ||
| 2008 | 1% | 18% | ||
| 2009 | 8% | 32% | ||
| 2010 | 4% | 5% | ||
| 2011 | 2% | 2% | ||
| 2012 | 1% | 9% | ||
| 2013 | 11% | 18% | ||
The standard deviation of the portfolio is
enter your response here%.
(Round to two decimal places.)
Step by Step Solution
There are 3 Steps involved in it
Step: 1

Get Instant Access to Expert-Tailored Solutions
See step-by-step solutions with expert insights and AI powered tools for academic success
Step: 2

Step: 3
Ace Your Homework with AI
Get the answers you need in no time with our AI-driven, step-by-step assistance
Get Started
Commodity Finance
Authors: Weixin Huang
2nd Edition
0857196650, 978-0857196651