

Answered step by step
Verified Expert Solution
Question
1 Approved Answer
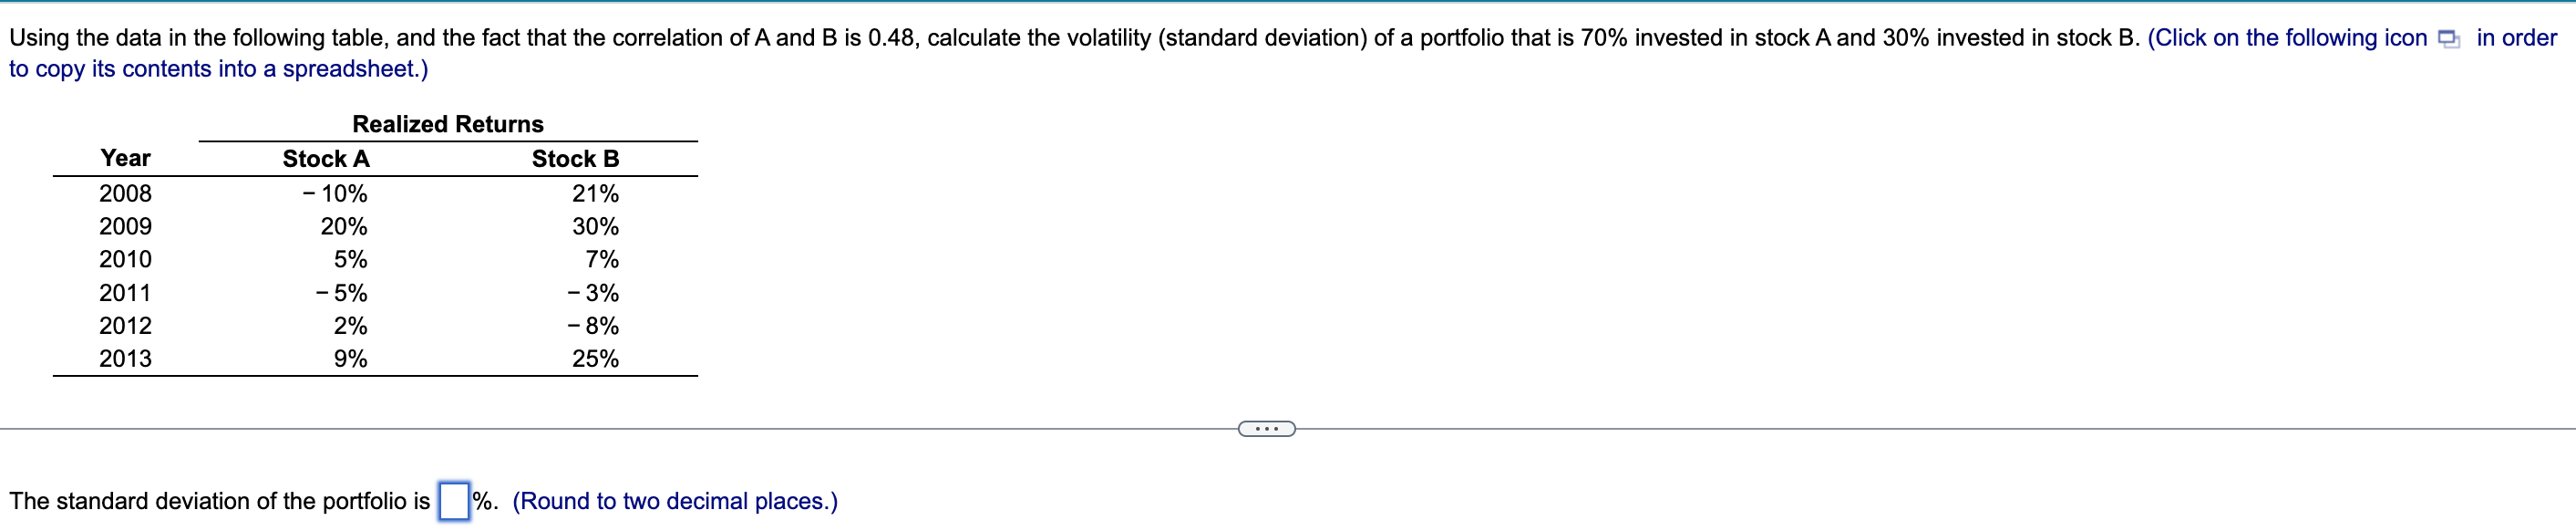
Using the data in the following table, and the fact that the correlation of A and B is 0.48, calculate the volatility (standard deviation) of
Step by Step Solution
There are 3 Steps involved in it
Step: 1

Get Instant Access to Expert-Tailored Solutions
See step-by-step solutions with expert insights and AI powered tools for academic success
Step: 2

Step: 3
Ace Your Homework with AI
Get the answers you need in no time with our AI-driven, step-by-step assistance
Get Started
Options Futures And Other Derivatives
Authors: John C. Hull
11th Edition
013693997X, 9780136939979