

Answered step by step
Verified Expert Solution
Question
1 Approved Answer
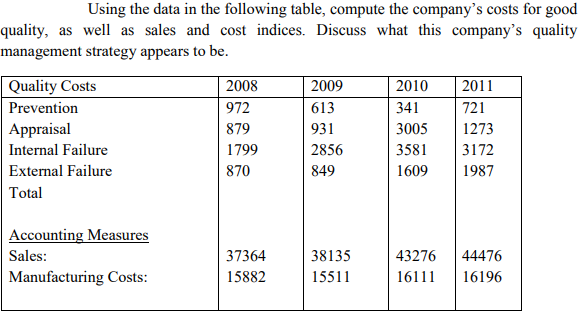
Using the data in the following table, compute the company's costs for good quality, as well as sales and cost indices. Discuss what this company's
Step by Step Solution
There are 3 Steps involved in it
Step: 1

Get Instant Access to Expert-Tailored Solutions
See step-by-step solutions with expert insights and AI powered tools for academic success
Step: 2

Step: 3
Ace Your Homework with AI
Get the answers you need in no time with our AI-driven, step-by-step assistance
Get Started
Construction Safety Auditing Made Easy A Checklist Approach To OSHA Compliance
Authors: Kathleen Hess
1st Edition
0865876355, 978-0865876354