

Answered step by step
Verified Expert Solution
Question
1 Approved Answer
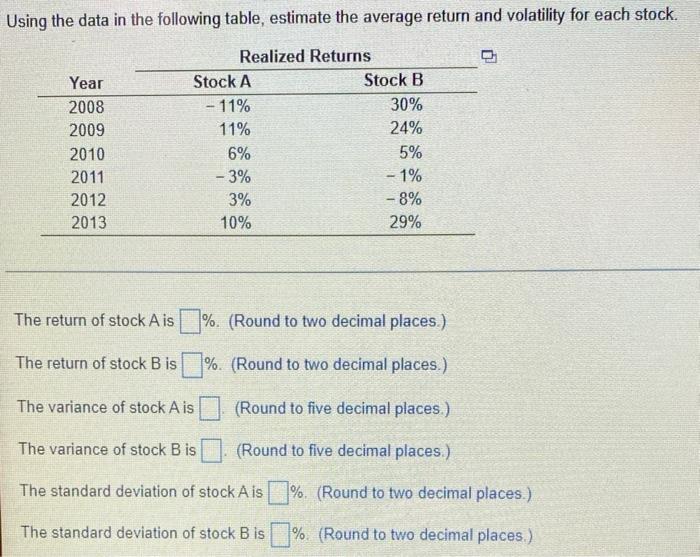
Using the data in the following table, estimate the average return and volatility for each stock. Realized Returns Year Stock A Stock B 2008 -
Step by Step Solution
There are 3 Steps involved in it
Step: 1

Get Instant Access to Expert-Tailored Solutions
See step-by-step solutions with expert insights and AI powered tools for academic success
Step: 2

Step: 3
Ace Your Homework with AI
Get the answers you need in no time with our AI-driven, step-by-step assistance
Get Started
Asymptotic Chaos Expansions In Finance Theory And Practice
Authors: David Nicolay
2014 Edition
1447165055, 9781447165057