Answered step by step
Verified Expert Solution
Link Copied!

Question

1 Approved Answer

Using the data in the following table, estimate the covariance between the stocks Year 2018 2019 2020 Stock A -10% 23% 5% Stock B 15%
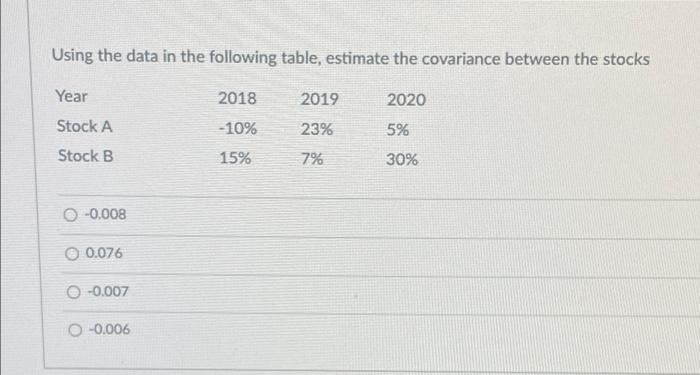
image text in transcribed
Using the data in the following table, estimate the covariance between the stocks Year 2018 2019 2020 Stock A -10% 23% 5% Stock B 15% 7% 30% -0.008 O 0.076 O-0.007 -0.006

Step by Step Solution

There are 3 Steps involved in it

Step: 1

blur-text-image

Get Instant Access to Expert-Tailored Solutions

See step-by-step solutions with expert insights and AI powered tools for academic success

Step: 2

blur-text-image_2

Step: 3

blur-text-image_3

Ace Your Homework with AI

Get the answers you need in no time with our AI-driven, step-by-step assistance

Get Started

Recommended Textbook for

Financial management theory and practice

Authors: Eugene F. Brigham and Michael C. Ehrhardt

13th edition

1439078106, 111197375X, 9781439078105, 9781111973759, 978-1439078099

More Books

Students also viewed these Finance questions

Question

Have they worked with a facilitator before, with what result?

Answered: 1 week ago