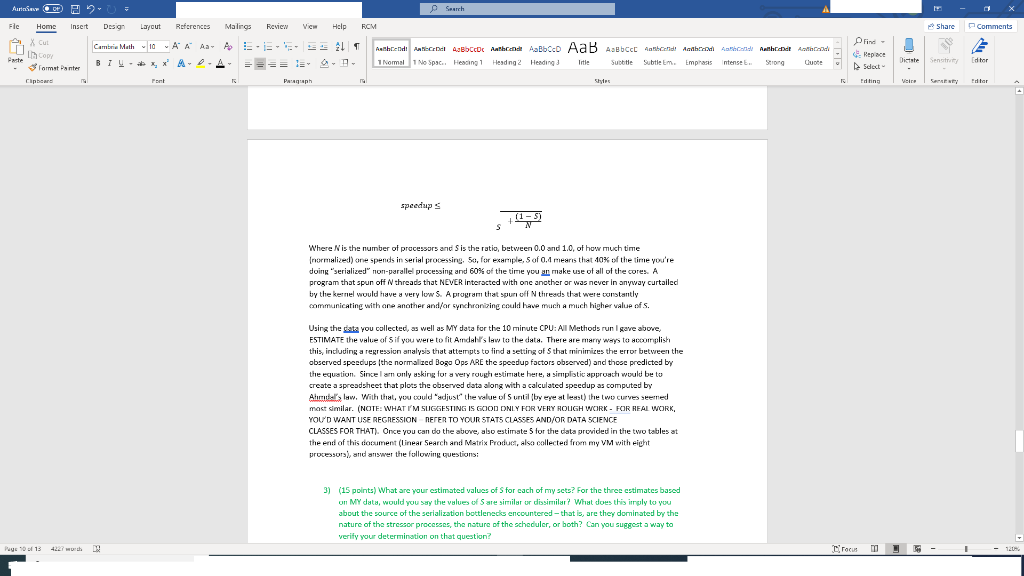
using the data in the second picture answer question in first picture
all information is provided


Aurinn PRO Search Fle Home Insert Design Layout References Malines Review Vic Help FCM Share Comments X Cut h Copy Paste 3 format Panter Clipboard Cambria Math 10 A A A AES 21 BIU-X APA- Authend And ABCD Aalbonde Abbcco AaB Aabcc Aabhaanid Android Anbard Anthracit And 1 No Spac. Hesing1 Heading 2 Heading Subtlem. Emphasis Strong 1 Normal ntense Repce Sdext Diste Title dhar Sense Fort Prograph Shyr Editar speedups (1- S Where N is the number of processors and Sis the ratio, between 0.0 and 1.0, of how much time (normalized) one spends in serial processing, 50, for example, 5 of 0.1 means that 10% of the time you're doing "serialized" non-parallel processing and 60% of the time you an make use of all of the cores. A program that spun off threads that NEVER interacted with one another or was never in anyway curtailed by the kernel would have a very low 5. A program that spurt off threads that were constantly communicating with one another and/or synchronizing could have much a much higher value of s. Using the data you collected, as well as MY data for the 10 minute CPU:All Methods run I gave above ESTIMATE the value of Sif you were to fit Amdall's law to the data. There are many ways to accomplish this, including a regression analysis that attempts to find a setting of that minimizes the error between the obscrved speecup the normalized Bogo Ops ARE the speedup factors observed) and those predicted by the equation. Since I am only asking for a very rough estimate here, a simplistic approach would be to create a spreadsheet that plots the observed data along with a calculated speedup as computed by Atrue's law. With that you could adjust the value of 5 untilby eye at least the two curves seemed most similar. (NOTE: WHAT I'M SUGGESTING IS GOOD ONLY FOR VERY ROUGH WORK FOR REAL WORK, YOU'D WANT USE REGRESSION REFER TO YOUR STATS CLASSES AND/OR DATA SCIENCE CLASSES FOR THAT). Once you can do the above, also estimate 5 for the data provided in the two tables at the end of this document (linear Search and Matrix Product, also collected from my VM with right processors), and answer the following questions: 3) () 3) (15 points) What are your estimated values of S for cach of my scts? For the three estimates based on MY data, would you say the values of Sare similar ur dissimilar? What does this imply to you about the source of the serialization bottlenecks encountered that is, are they dominated by the nature of the stressor processes, the nature of the scheduler, or both? Can you suggest a way to verify your determination on that question? Pays 10 of 13 4227 wrth 19 rocum Aurinn p Search Fle Home Insert Design Layout References IMG HEMICW VICH HEID HLM Share Comments Repce X Cut h Copy Paste 3 format Panter Clipboard ntense Dishe Sense dhar Cambria Math 10 AA A A Aa A.EL Aanbrend Android ABCD Aabricade Aalbo AaB Aebct abband! Acabamdi Ambid Manthirat Arad BIU-X APA- I Normal 1 1 No Spac. Hesing1 Heading 2 Heading Title Subtle Subtle En. Emphasis Strong Quote Fort Paph 0 O 1 3 4 5 6 7 9 Editing Editar BOPSUST 345.75 239.99 222.1. 10 Minute Data CPU: All Methods Bogo Ops 1 147441 2 207492 3 399731 4 502103 5 004907 G&8833 7 740412 79162 209.25 201.00 191.40 178.21 106.52 Notice that my graph seems to indicate that we are not getting perfect speedup. I'm not exactly two times as fast with two processors as I am with one. In fact, when I have cight processors on the task, it seems that my throughout is only 5.4 times bigger than it was when I had one processor. There are likely more than one reason for this. One would be Amdahl's Law (https://en.wikipedia.org/wiki/Amdahl%27s law and Chapter 4, page 164, of the textbook). Even though the test stressor chuser is intended to be CPU interisive lots of lung CPU bursts, very few 10 bursts), it could be the case that the stressor code is not 100% parallelizable. A second would be the overhead involved in context switching as processar load increases. Even if the stressor WAS 100% parallelicable, the context switching that has to occur as the system load goes up is not, and that will have effects on throughput. Let's assume what we're seeing in terms of the non-linear speedup curve as being some combination of the two causes. Before trying to sort out how much of each of the two causes is in play, let's first think about how to estimate the value S (the portion of the amount of time that is spent in serialized processing when running on processing cores). You may recall that Amdahl's law can be stated as: 1 Peys 13 racus Type here to Aurinn PRO Search Fle Home Insert Design Layout References Malines Review Vic Help FCM Share Comments X Cut h Copy Paste 3 format Panter Clipboard Cambria Math 10 A A A AES 21 BIU-X APA- Authend And ABCD Aalbonde Abbcco AaB Aabcc Aabhaanid Android Anbard Anthracit And 1 No Spac. Hesing1 Heading 2 Heading Subtlem. Emphasis Strong 1 Normal ntense Repce Sdext Diste Title dhar Sense Fort Prograph Shyr Editar speedups (1- S Where N is the number of processors and Sis the ratio, between 0.0 and 1.0, of how much time (normalized) one spends in serial processing, 50, for example, 5 of 0.1 means that 10% of the time you're doing "serialized" non-parallel processing and 60% of the time you an make use of all of the cores. A program that spun off threads that NEVER interacted with one another or was never in anyway curtailed by the kernel would have a very low 5. A program that spurt off threads that were constantly communicating with one another and/or synchronizing could have much a much higher value of s. Using the data you collected, as well as MY data for the 10 minute CPU:All Methods run I gave above ESTIMATE the value of Sif you were to fit Amdall's law to the data. There are many ways to accomplish this, including a regression analysis that attempts to find a setting of that minimizes the error between the obscrved speecup the normalized Bogo Ops ARE the speedup factors observed) and those predicted by the equation. Since I am only asking for a very rough estimate here, a simplistic approach would be to create a spreadsheet that plots the observed data along with a calculated speedup as computed by Atrue's law. With that you could adjust the value of 5 untilby eye at least the two curves seemed most similar. (NOTE: WHAT I'M SUGGESTING IS GOOD ONLY FOR VERY ROUGH WORK FOR REAL WORK, YOU'D WANT USE REGRESSION REFER TO YOUR STATS CLASSES AND/OR DATA SCIENCE CLASSES FOR THAT). Once you can do the above, also estimate 5 for the data provided in the two tables at the end of this document (linear Search and Matrix Product, also collected from my VM with right processors), and answer the following questions: 3) () 3) (15 points) What are your estimated values of S for cach of my scts? For the three estimates based on MY data, would you say the values of Sare similar ur dissimilar? What does this imply to you about the source of the serialization bottlenecks encountered that is, are they dominated by the nature of the stressor processes, the nature of the scheduler, or both? Can you suggest a way to verify your determination on that question? Pays 10 of 13 4227 wrth 19 rocum Aurinn p Search Fle Home Insert Design Layout References IMG HEMICW VICH HEID HLM Share Comments Repce X Cut h Copy Paste 3 format Panter Clipboard ntense Dishe Sense dhar Cambria Math 10 AA A A Aa A.EL Aanbrend Android ABCD Aabricade Aalbo AaB Aebct abband! Acabamdi Ambid Manthirat Arad BIU-X APA- I Normal 1 1 No Spac. Hesing1 Heading 2 Heading Title Subtle Subtle En. Emphasis Strong Quote Fort Paph 0 O 1 3 4 5 6 7 9 Editing Editar BOPSUST 345.75 239.99 222.1. 10 Minute Data CPU: All Methods Bogo Ops 1 147441 2 207492 3 399731 4 502103 5 004907 G&8833 7 740412 79162 209.25 201.00 191.40 178.21 106.52 Notice that my graph seems to indicate that we are not getting perfect speedup. I'm not exactly two times as fast with two processors as I am with one. In fact, when I have cight processors on the task, it seems that my throughout is only 5.4 times bigger than it was when I had one processor. There are likely more than one reason for this. One would be Amdahl's Law (https://en.wikipedia.org/wiki/Amdahl%27s law and Chapter 4, page 164, of the textbook). Even though the test stressor chuser is intended to be CPU interisive lots of lung CPU bursts, very few 10 bursts), it could be the case that the stressor code is not 100% parallelizable. A second would be the overhead involved in context switching as processar load increases. Even if the stressor WAS 100% parallelicable, the context switching that has to occur as the system load goes up is not, and that will have effects on throughput. Let's assume what we're seeing in terms of the non-linear speedup curve as being some combination of the two causes. Before trying to sort out how much of each of the two causes is in play, let's first think about how to estimate the value S (the portion of the amount of time that is spent in serialized processing when running on processing cores). You may recall that Amdahl's law can be stated as: 1 Peys 13 racus Type here to


