

Question
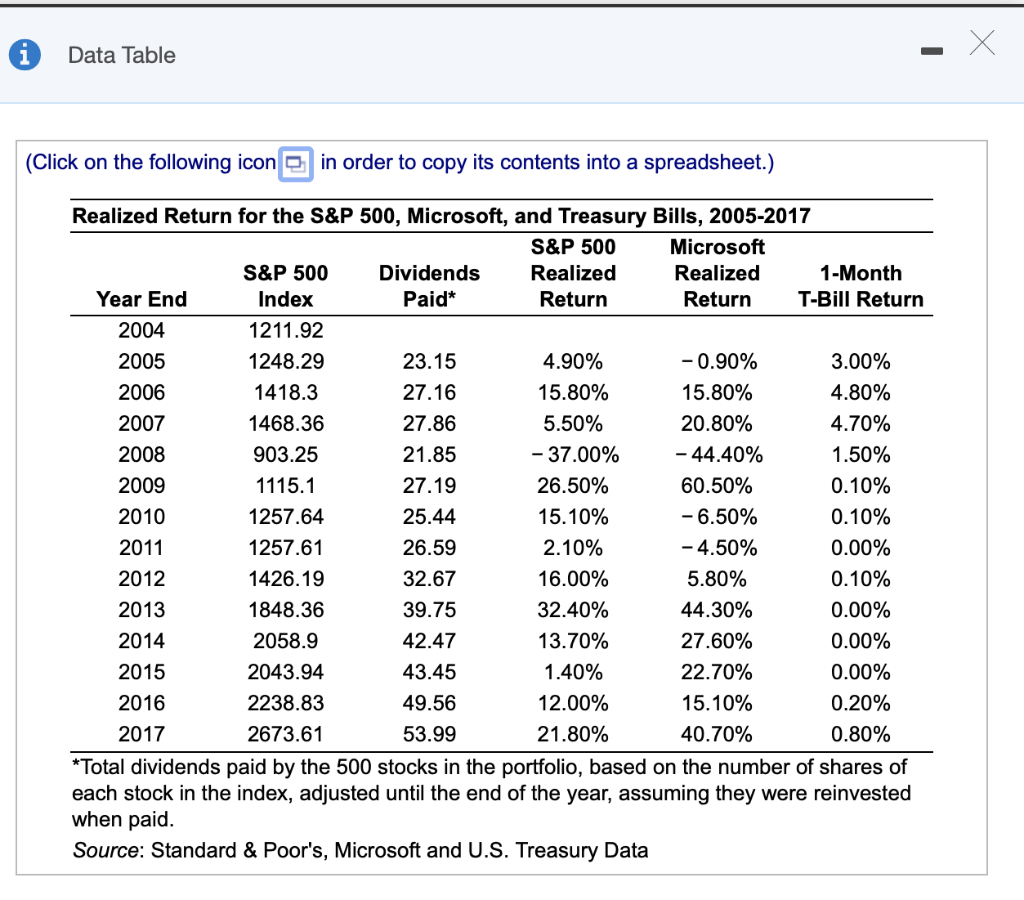
Using the data in the table below a. What was the average dividend yield for the S&P 500 from 2005-2017? The average dividend yield is
Using the data in the table below
a. What was the average dividend yield for the S&P 500 from 2005-2017?
The average dividend yield is ............%. (Round to two decimal places.)
b. What was the volatility of the dividend yield?
The volatility of the dividend yield is the square root of the variance of dividend yields .............%.(Round to two decimal places.)
c. What was the average annual return of the S&P 500 from 2005-2017 excluding dividends (i.e., from capital gains only)?
The average annual return is ............%.(Round to two decimal places.)
d. What was the volatility of the S&P 500 returns from capital gains?
Annual volatility of returns is the square root of the variance of returns............%.(Round to two decimal places.)
e. Were dividends or capital gains a more important component of the S&P 500's average returns during this period? Which were the more important source of volatility?(Select one)
(dividend..... or ......capital gains) were more important for returns and volatility.
Step by Step Solution
There are 3 Steps involved in it
Step: 1

Get Instant Access to Expert-Tailored Solutions
See step-by-step solutions with expert insights and AI powered tools for academic success
Step: 2

Step: 3
Ace Your Homework with AI
Get the answers you need in no time with our AI-driven, step-by-step assistance
Get Started
Financial Valuation Of Employee Stock Ownership Plan Shares
Authors: Larry R. Cook
1st Edition
0471678473, 978-0471678472