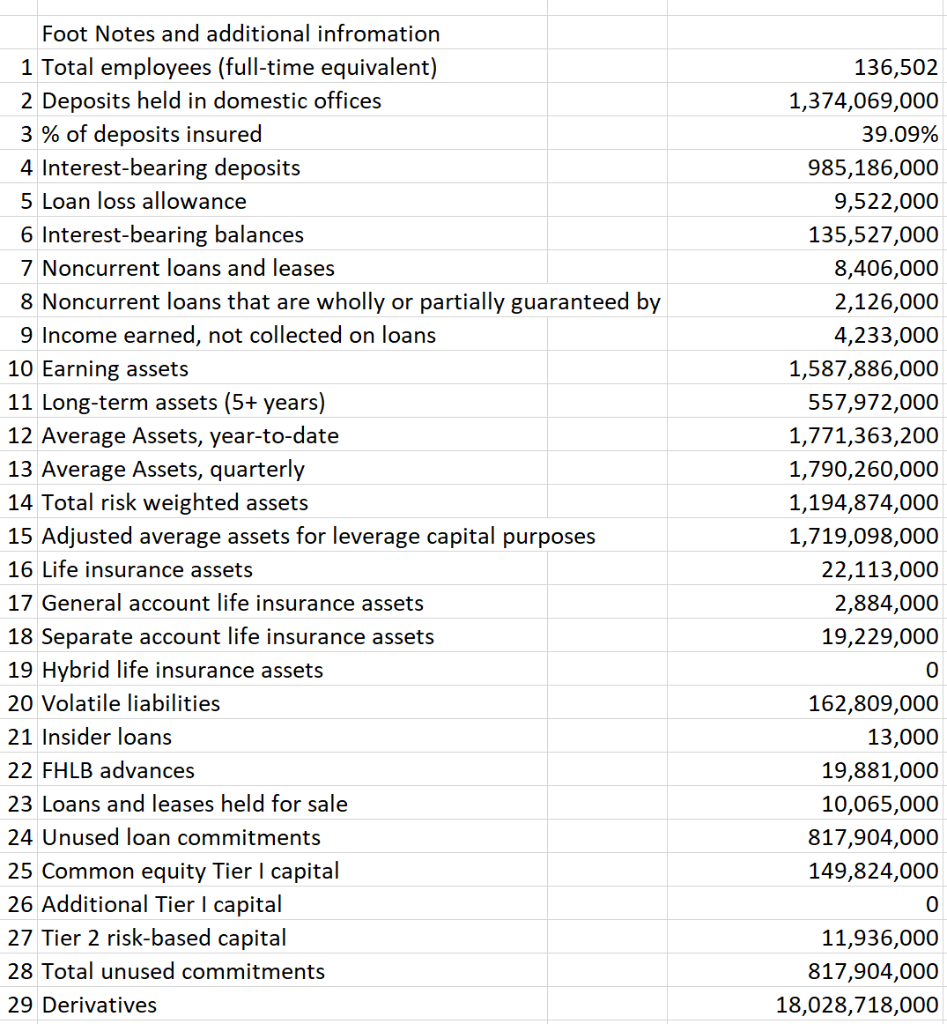
- Using the data provided in the footnotes of the balance sheet for 2018 compute:
- Common equity Tier I risk based ratio
- Tier I risk based ratio
- Total risk based ratio
- Tier I leverage ratio (for Total Exposure use Total Assets)
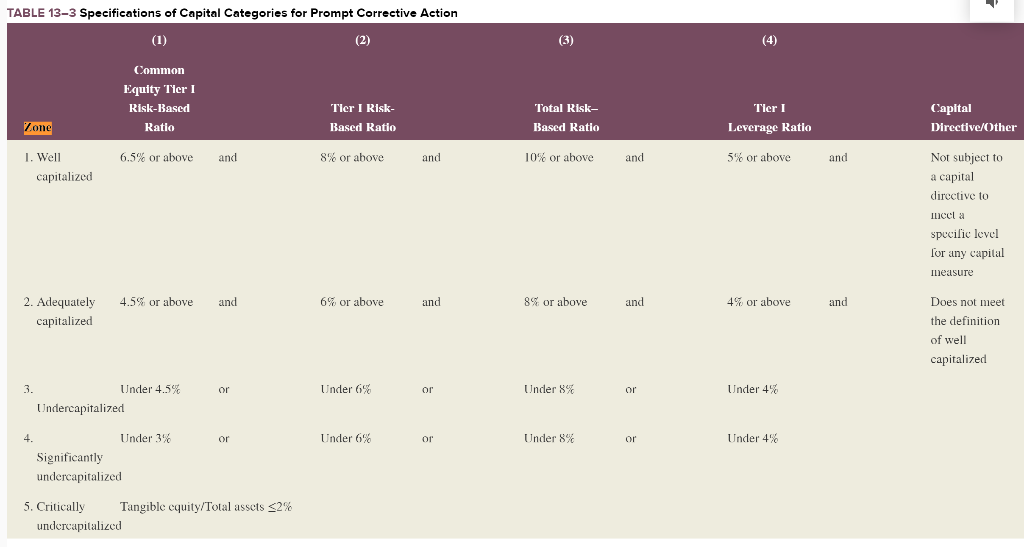
- Using Table 13-3 in your text as a guide, in which Zone would you place BOA?


Foot Notes and additional infromation 1 Total employees (full-time equivalent) 136,502 2 Deposits held in domestic offices 1,374,069,000 3 % of deposits insured 4 Interest-bearing deposits 39.09% 985,186,000 5 Loan loss allowance 9,522,000 6 Interest-bearing balances 135,527,000 7 Noncurrent loans and leases 8,406,000 8 Noncurrent loans that are wholly partially guaranteed by 2,126,000 or 9 Income earned, not collected on loans 4,233,000 1,587,886,000 10 Earning assets 11 Long-term assets (5+ years) 557,972,000 12 Average Assets, year-to-date 1,771,363,200 13 Average Assets, quarterly 14 Total risk weighted 15 Adjusted average assets for leverage capital purposes 1,790,260,000 1,194,874,000 assets 1,719,098,000 16 Life insurance assets 22,113,000 17 General account life insurance assets 2,884,000 18 Separate account life insurance assets 19,229,000 19 Hybrid life insurance assets 20 Volatile liabilities 162,809,000 21 Insider loans 13,000 22 FHLB advances 19,881,000 23 Loans and leases held for sale 10,065,000 24 Unused loan commitments 817,904,000 25 Common equity Tier I capital 26 Additional Tier I capital 149,824,000 0 27 Tier 2 risk-based capital 11,936,000 28 Total unused commitments 817,904,000 18,028,718,000 29 Derivatives TABLE 13-3 Specifications of Capital Categories for Prompt Corrective Action (3) (1) (4) (2) Common Equity Tier I Tier I Risk Based Ratio Total Risk- Risk-Based Tier Capital Based Ratio Leverage Ratio Zone Ratio Directive/Other 6.5% or above Not subject to pital and 5% or above I. Well and 8% or above 10% or above and and capitalized dircctive te cl a specilic level Tor any capital Ieasure and and 4,5% or above 2. Adequately 6% or above 8% or above 4% r above and Does not meet and capitalized the definition of wel capitalized Under 8 Under 4.5% Under 6% Under 4% 3 or Undercapitalized Under 8 Under 3% Under 6% Under 4% 4 or 01 Significantly undercapitalized 5. Critically Tangible equity/Total assets 2% undercapitalized Foot Notes and additional infromation 1 Total employees (full-time equivalent) 136,502 2 Deposits held in domestic offices 1,374,069,000 3 % of deposits insured 4 Interest-bearing deposits 39.09% 985,186,000 5 Loan loss allowance 9,522,000 6 Interest-bearing balances 135,527,000 7 Noncurrent loans and leases 8,406,000 8 Noncurrent loans that are wholly partially guaranteed by 2,126,000 or 9 Income earned, not collected on loans 4,233,000 1,587,886,000 10 Earning assets 11 Long-term assets (5+ years) 557,972,000 12 Average Assets, year-to-date 1,771,363,200 13 Average Assets, quarterly 14 Total risk weighted 15 Adjusted average assets for leverage capital purposes 1,790,260,000 1,194,874,000 assets 1,719,098,000 16 Life insurance assets 22,113,000 17 General account life insurance assets 2,884,000 18 Separate account life insurance assets 19,229,000 19 Hybrid life insurance assets 20 Volatile liabilities 162,809,000 21 Insider loans 13,000 22 FHLB advances 19,881,000 23 Loans and leases held for sale 10,065,000 24 Unused loan commitments 817,904,000 25 Common equity Tier I capital 26 Additional Tier I capital 149,824,000 0 27 Tier 2 risk-based capital 11,936,000 28 Total unused commitments 817,904,000 18,028,718,000 29 Derivatives TABLE 13-3 Specifications of Capital Categories for Prompt Corrective Action (3) (1) (4) (2) Common Equity Tier I Tier I Risk Based Ratio Total Risk- Risk-Based Tier Capital Based Ratio Leverage Ratio Zone Ratio Directive/Other 6.5% or above Not subject to pital and 5% or above I. Well and 8% or above 10% or above and and capitalized dircctive te cl a specilic level Tor any capital Ieasure and and 4,5% or above 2. Adequately 6% or above 8% or above 4% r above and Does not meet and capitalized the definition of wel capitalized Under 8 Under 4.5% Under 6% Under 4% 3 or Undercapitalized Under 8 Under 3% Under 6% Under 4% 4 or 01 Significantly undercapitalized 5. Critically Tangible equity/Total assets 2% undercapitalized


