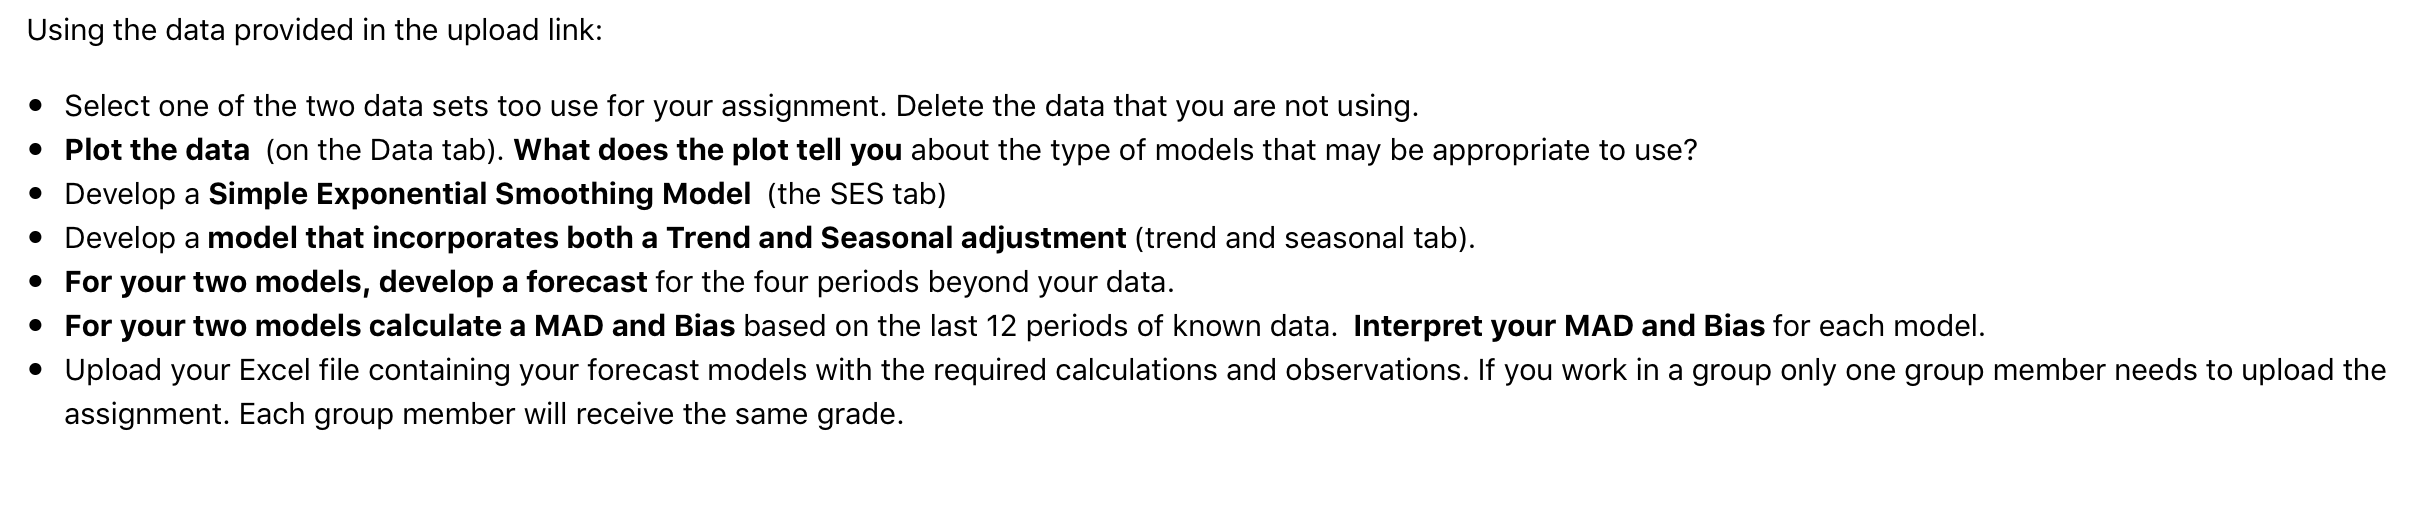
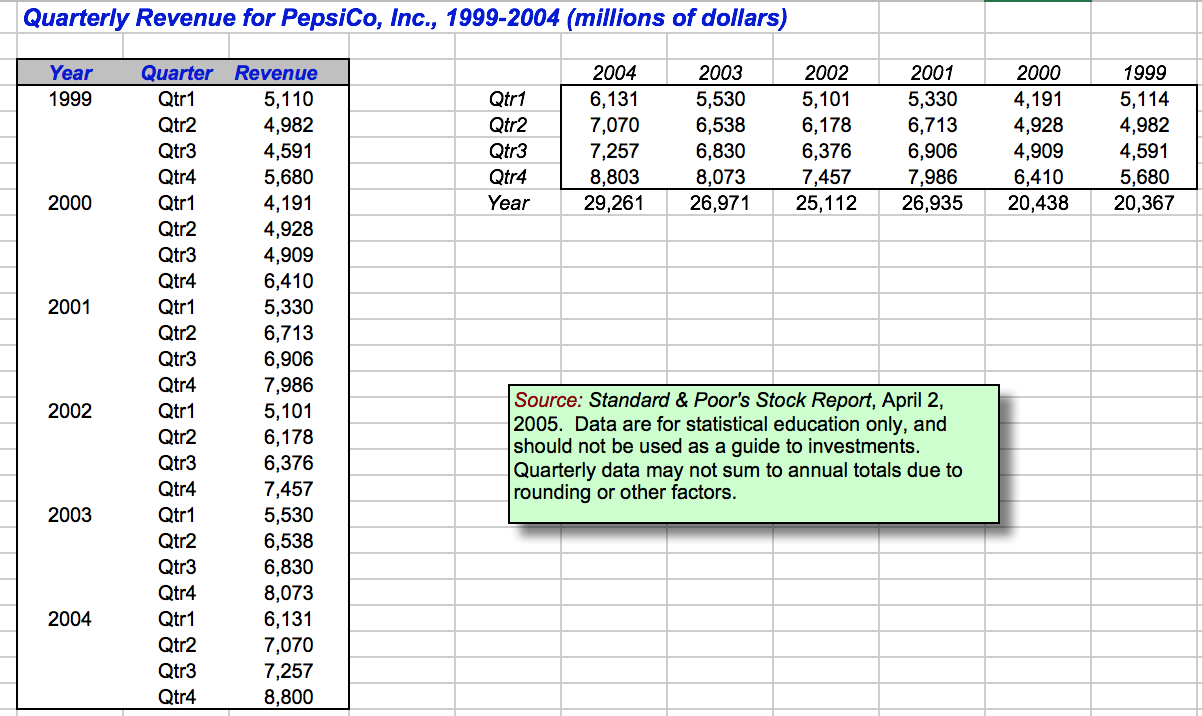
Using the data provided in the upload link: Select one of the two data sets too use for your assignment. Delete the data that you are not using. Plot the data on the Data tab). What does the plot tell you about the type of models that may be appropriate to use? Develop a Simple Exponential Smoothing Model (the SES tab) Develop a model that incorporates both a Trend and Seasonal adjustment (trend and seasonal tab). For your two models, develop a forecast for the four periods beyond your data. For your two models calculate a MAD and Bias based on the last 12 periods of known data. Interpret your MAD and Bias for each model. Upload your Excel file containing your forecast models with the required calculations and observations. If you work in a group only one group member needs to upload the assignment. Each group member will receive the same grade. Quarterly Revenue for PepsiCo, Inc., 1999-2004 (millions of dollars) Year 1999 Qtr1 Qtr2 Qtr3 Qtr4 Year 2004 6,131 7,070 7,257 8,803 29,261 2003 5,530 6,538 6,830 8,073 26,971 2002 5,101 6,178 6,376 7,457 25,112 2001 5,330 6,713 6,906 7,986 26,935 2000 4,191 4,928 4,909 6,410 20,438 1999 5,114 4,982 4,591 5,680 20,367 2000 2001 Quarter Qtr 1 Qtr2 Qtr3 Qtr4 Qtr 1 Qtr2 Qtr3 Qtr4 Qtr 1 Qtr2 Qtr3 Qtr4 Qtr 1 Qtr2 Qtr3 Qtr4 Qtr1 Qtr2 Qtr3 Qtr4 Qtr 1 Qtr2 Qtr3 Qtr4 Revenue 5,110 4,982 4,591 5,680 4,191 4,928 4,909 6,410 5,330 6,713 6,906 7,986 5,101 6,178 6,376 7,457 5,530 6,538 6,830 8,073 6,131 7,070 7,257 8,800 2002 Source: Standard & Poor's Stock Report, April 2, 2005. Data are for statistical education only, and should not be used as a guide to investments. Quarterly data may not sum to annual totals due to rounding or other factors. 2003 2004 Using the data provided in the upload link: Select one of the two data sets too use for your assignment. Delete the data that you are not using. Plot the data on the Data tab). What does the plot tell you about the type of models that may be appropriate to use? Develop a Simple Exponential Smoothing Model (the SES tab) Develop a model that incorporates both a Trend and Seasonal adjustment (trend and seasonal tab). For your two models, develop a forecast for the four periods beyond your data. For your two models calculate a MAD and Bias based on the last 12 periods of known data. Interpret your MAD and Bias for each model. Upload your Excel file containing your forecast models with the required calculations and observations. If you work in a group only one group member needs to upload the assignment. Each group member will receive the same grade. Quarterly Revenue for PepsiCo, Inc., 1999-2004 (millions of dollars) Year 1999 Qtr1 Qtr2 Qtr3 Qtr4 Year 2004 6,131 7,070 7,257 8,803 29,261 2003 5,530 6,538 6,830 8,073 26,971 2002 5,101 6,178 6,376 7,457 25,112 2001 5,330 6,713 6,906 7,986 26,935 2000 4,191 4,928 4,909 6,410 20,438 1999 5,114 4,982 4,591 5,680 20,367 2000 2001 Quarter Qtr 1 Qtr2 Qtr3 Qtr4 Qtr 1 Qtr2 Qtr3 Qtr4 Qtr 1 Qtr2 Qtr3 Qtr4 Qtr 1 Qtr2 Qtr3 Qtr4 Qtr1 Qtr2 Qtr3 Qtr4 Qtr 1 Qtr2 Qtr3 Qtr4 Revenue 5,110 4,982 4,591 5,680 4,191 4,928 4,909 6,410 5,330 6,713 6,906 7,986 5,101 6,178 6,376 7,457 5,530 6,538 6,830 8,073 6,131 7,070 7,257 8,800 2002 Source: Standard & Poor's Stock Report, April 2, 2005. Data are for statistical education only, and should not be used as a guide to investments. Quarterly data may not sum to annual totals due to rounding or other factors. 2003 2004


