

Answered step by step
Verified Expert Solution
Question
1 Approved Answer
using the data set library(poliscidata) RStudio 2. (Dataset: nes. Variables: gay_marry, libcon3, wt.) should gay couples be legally permitted to marry? This controversial issue has
using the data set library("poliscidata")
RStudio
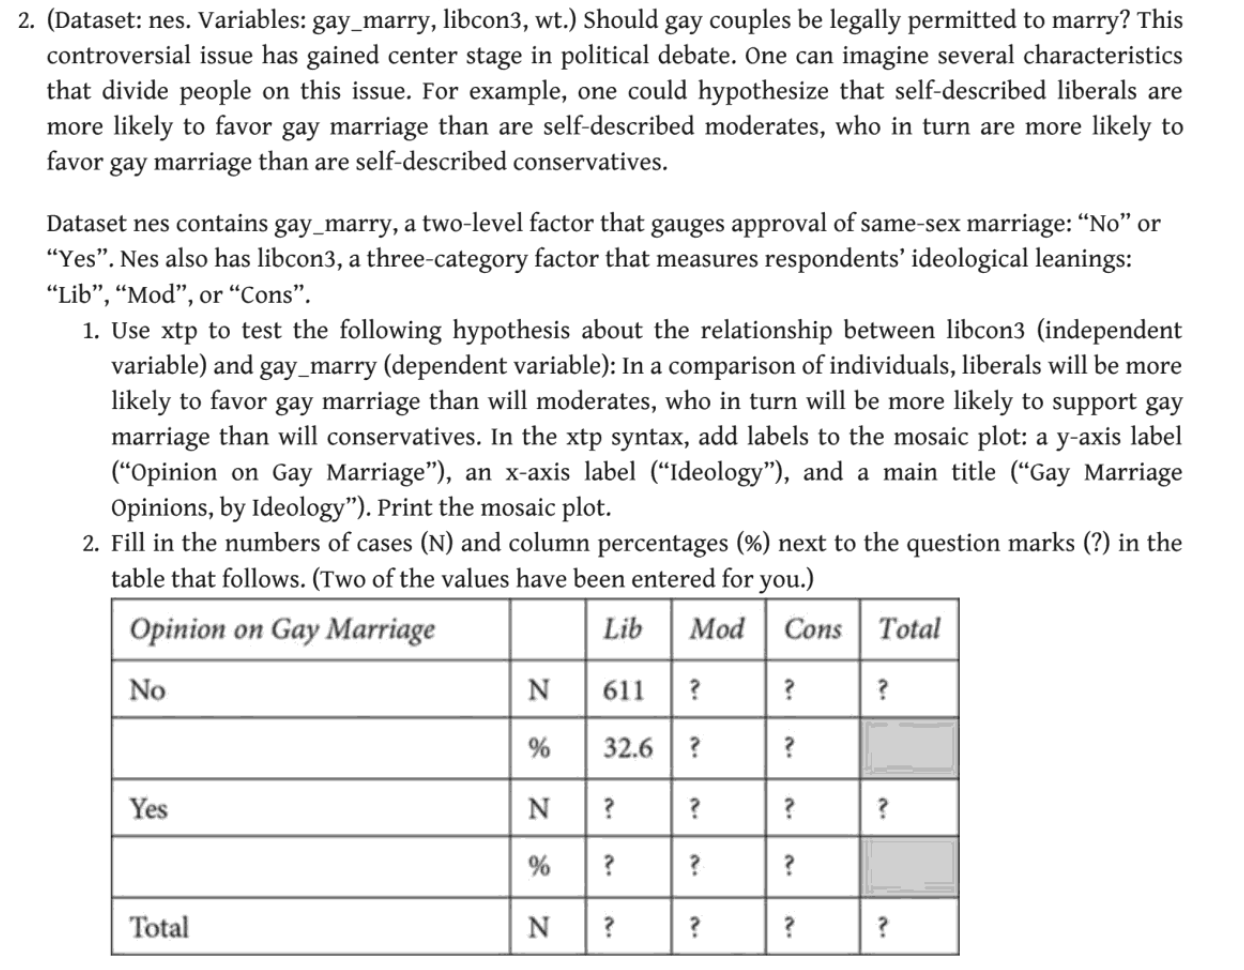
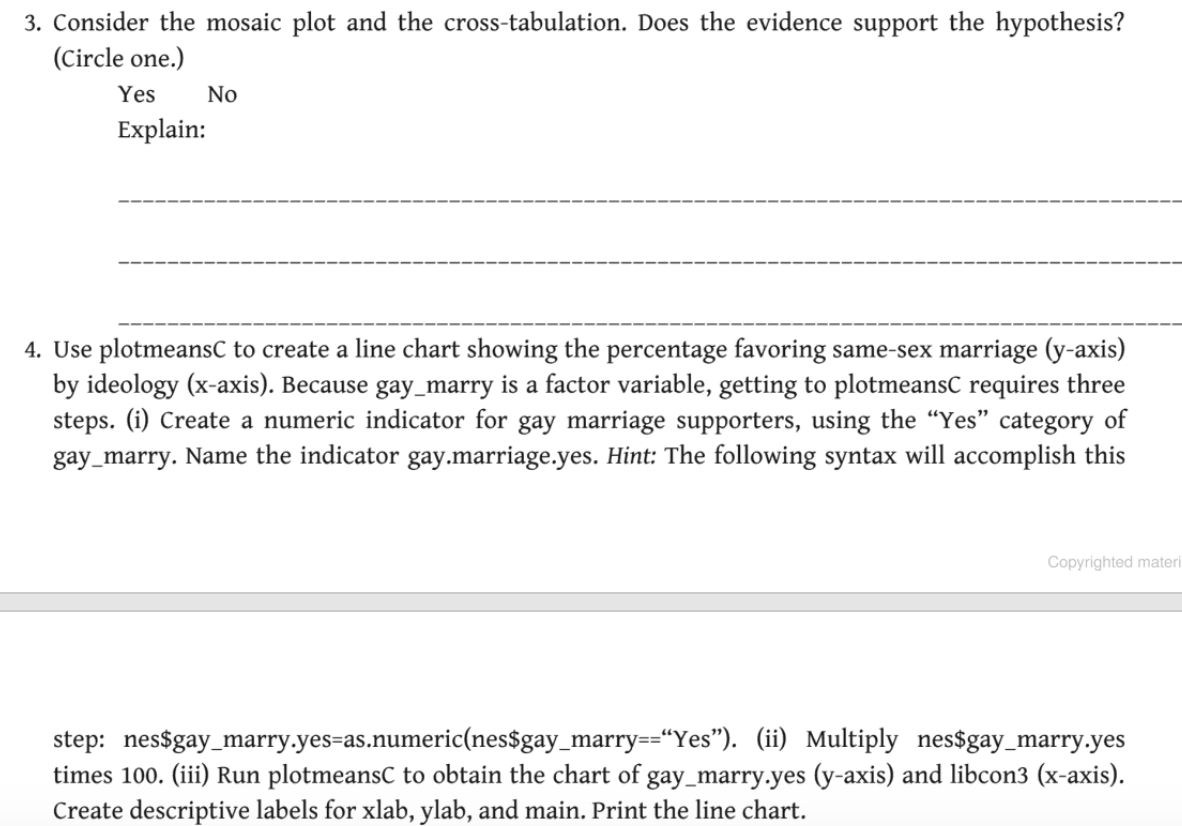
2. (Dataset: nes. Variables: gay_marry, libcon3, wt.) should gay couples be legally permitted to marry? This controversial issue has gained center stage in political debate. One can imagine several characteristics that divide people on this issue. For example, one could hypothesize that self-described liberals are more likely to favor gay marriage than are self-described moderates, who in turn are more likely to favor gay marriage than are self-described conservatives. Dataset nes contains gay_marry, a two-level factor that gauges approval of same-sex marriage: No or Yes. Nes also has libcon3, a three-category factor that measures respondents ideological leanings: Lib, Mod, or Cons. 1. Use xtp to test the following hypothesis about the relationship between libcon3 (independent variable) and gay_marry (dependent variable): In a comparison of individuals, liberals will be more likely to favor gay marriage than will moderates, who in turn will be more likely to support gay marriage than will conservatives. In the xtp syntax, add labels to the mosaic plot: a y-axis label (Opinion on Gay Marriage), an x-axis label (Ideology), and a main title (Gay Marriage Opinions, by Ideology). Print the mosaic plot. 2. Fill in the numbers of cases (N) and column percentages (%) next to the question marks (?) in the table that follows. (Two of the values have been entered for you.) Opinion on Gay Marriage Lib Mod Cons Total No N 611 ? ? ? 32.6 ? ? Yes Total 3. Consider the mosaic plot and the cross-tabulation. Does the evidence support the hypothesis? (Circle one.) Yes No Explain: ----- 4. Use plotmeans to create a line chart showing the percentage favoring same-sex marriage (y-axis) by ideology (x-axis). Because gay_marry is a factor variable, getting to plotmeansC requires three steps. (i) Create a numeric indicator for gay marriage supporters, using the Yes category of gay_marry. Name the indicator gay.marriage.yes. Hint: The following syntax will accomplish this Copyrighted materi step: nes$gay_marry.yes-as.numeric(nes$gay_marry==Yes). (ii) Multiply nes$gay_marry.yes times 100. (iii) Run plotmeans to obtain the chart of gay marry.yes (y-axis) and libcon3 (x-axis). Create descriptive labels for xlab, ylab, and main. Print the line chart. 2. (Dataset: nes. Variables: gay_marry, libcon3, wt.) should gay couples be legally permitted to marry? This controversial issue has gained center stage in political debate. One can imagine several characteristics that divide people on this issue. For example, one could hypothesize that self-described liberals are more likely to favor gay marriage than are self-described moderates, who in turn are more likely to favor gay marriage than are self-described conservatives. Dataset nes contains gay_marry, a two-level factor that gauges approval of same-sex marriage: No or Yes. Nes also has libcon3, a three-category factor that measures respondents ideological leanings: Lib, Mod, or Cons. 1. Use xtp to test the following hypothesis about the relationship between libcon3 (independent variable) and gay_marry (dependent variable): In a comparison of individuals, liberals will be more likely to favor gay marriage than will moderates, who in turn will be more likely to support gay marriage than will conservatives. In the xtp syntax, add labels to the mosaic plot: a y-axis label (Opinion on Gay Marriage), an x-axis label (Ideology), and a main title (Gay Marriage Opinions, by Ideology). Print the mosaic plot. 2. Fill in the numbers of cases (N) and column percentages (%) next to the question marks (?) in the table that follows. (Two of the values have been entered for you.) Opinion on Gay Marriage Lib Mod Cons Total No N 611 ? ? ? 32.6 ? ? Yes Total 3. Consider the mosaic plot and the cross-tabulation. Does the evidence support the hypothesis? (Circle one.) Yes No Explain: ----- 4. Use plotmeans to create a line chart showing the percentage favoring same-sex marriage (y-axis) by ideology (x-axis). Because gay_marry is a factor variable, getting to plotmeansC requires three steps. (i) Create a numeric indicator for gay marriage supporters, using the Yes category of gay_marry. Name the indicator gay.marriage.yes. Hint: The following syntax will accomplish this Copyrighted materi step: nes$gay_marry.yes-as.numeric(nes$gay_marry==Yes). (ii) Multiply nes$gay_marry.yes times 100. (iii) Run plotmeans to obtain the chart of gay marry.yes (y-axis) and libcon3 (x-axis). Create descriptive labels for xlab, ylab, and main. Print the line chartStep by Step Solution
There are 3 Steps involved in it
Step: 1

Get Instant Access to Expert-Tailored Solutions
See step-by-step solutions with expert insights and AI powered tools for academic success
Step: 2

Step: 3
Ace Your Homework with AI
Get the answers you need in no time with our AI-driven, step-by-step assistance
Get Started
Oracle Solaris 11.2 System Administration (oracle Press)
Authors: Harry Foxwell
1st Edition
007184421X, 9780071844215