

Question
Using the different financial ratios for Pfizer Inc.: 1) critically evaluate the financial statements individually across the 4-year period and cross-sectionally and identify their main
Using the different financial ratios for Pfizer Inc.:
1) critically evaluate the financial statements individually across the 4-year period and cross-sectionally and identify their main strengths and weaknesses
2) make recommendations for future improvement
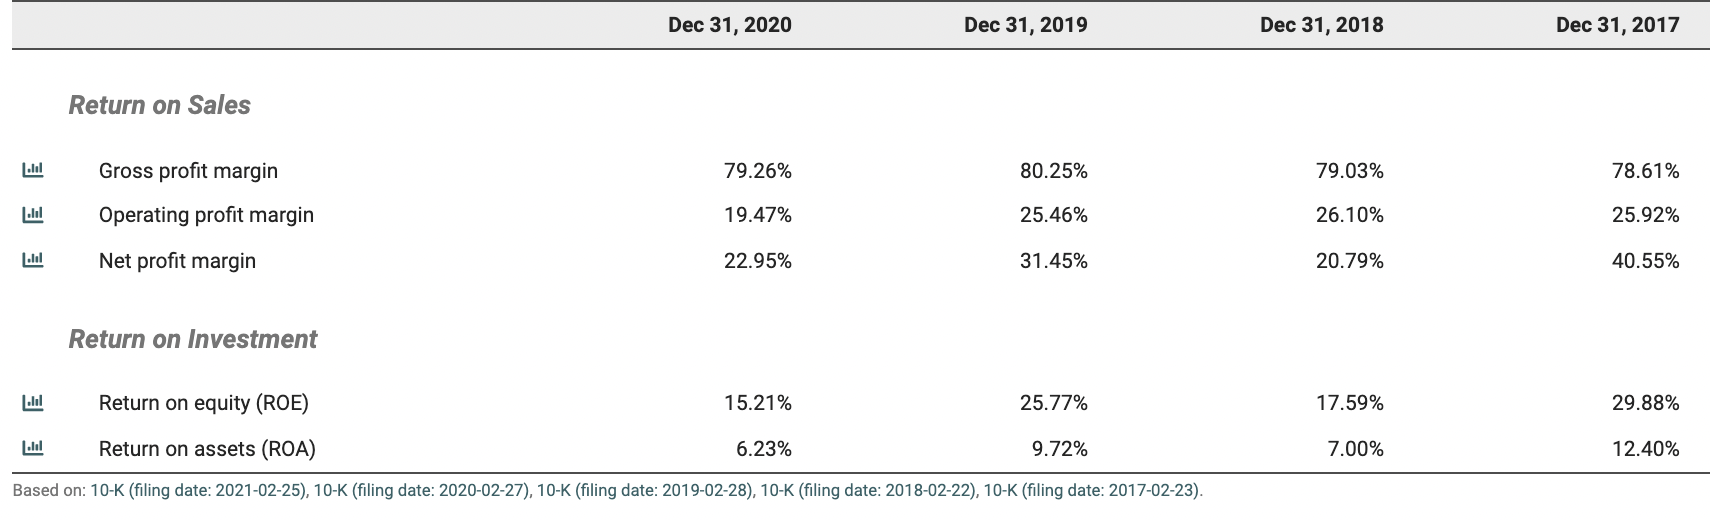
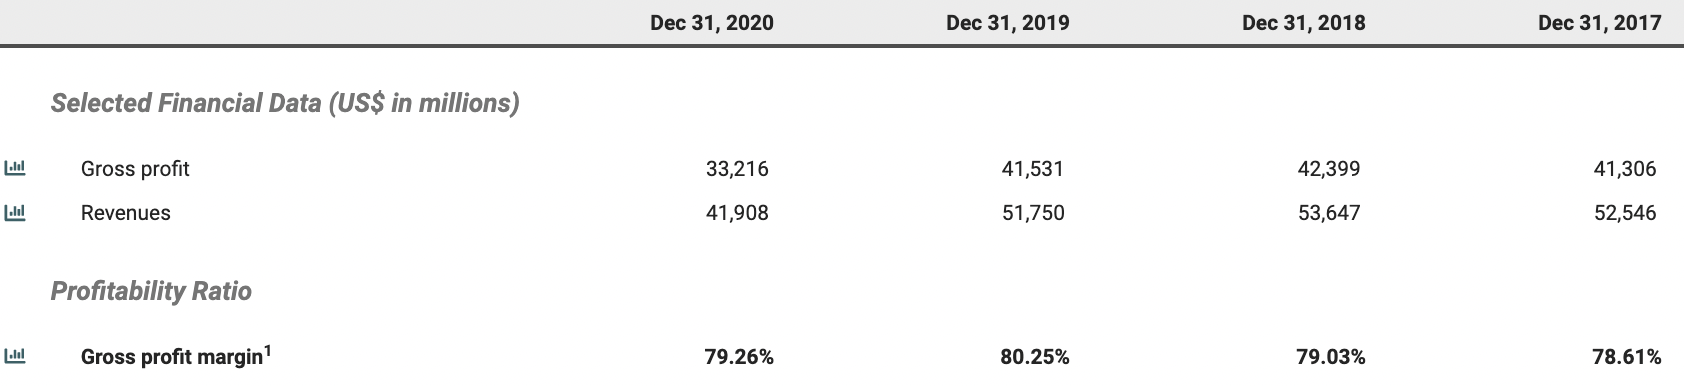
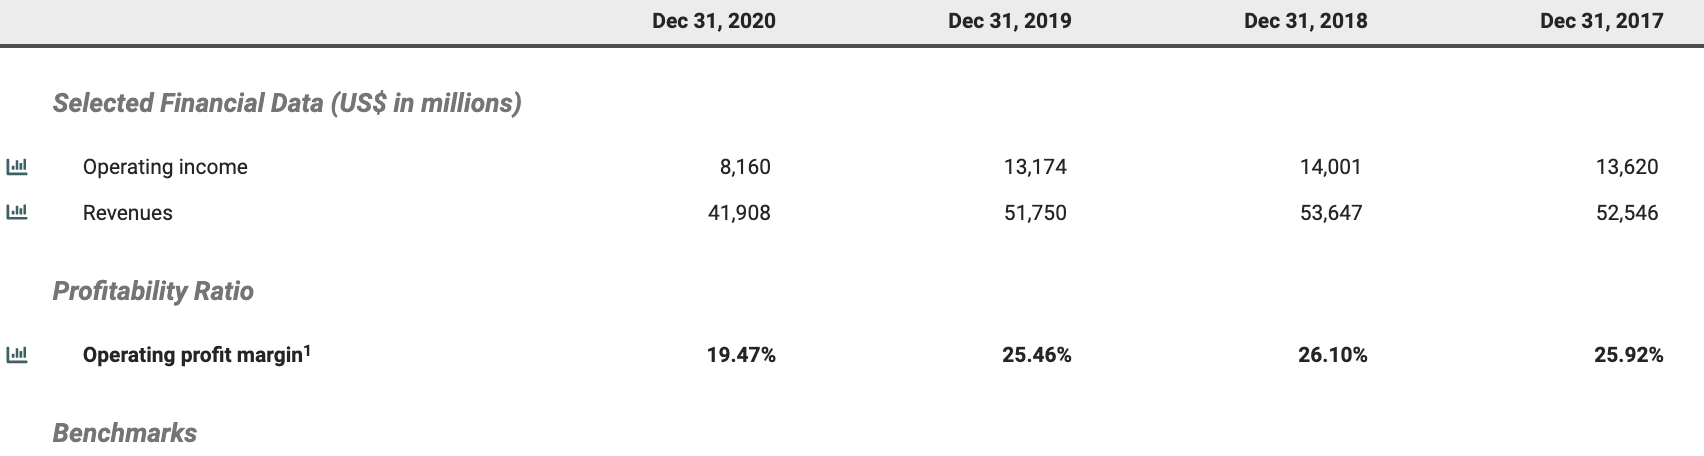
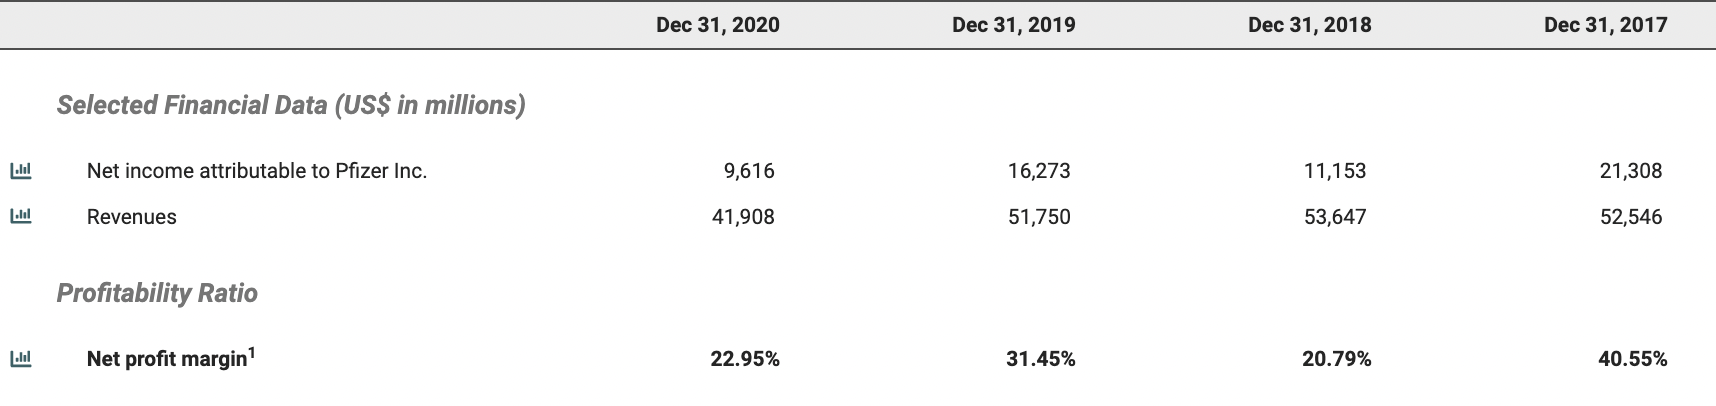
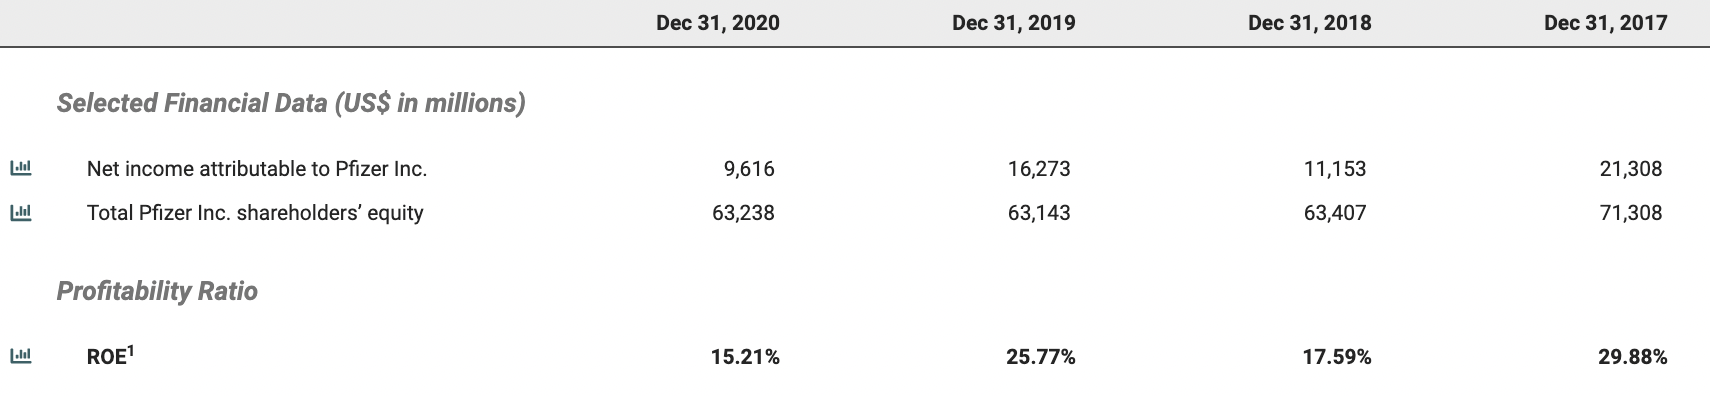
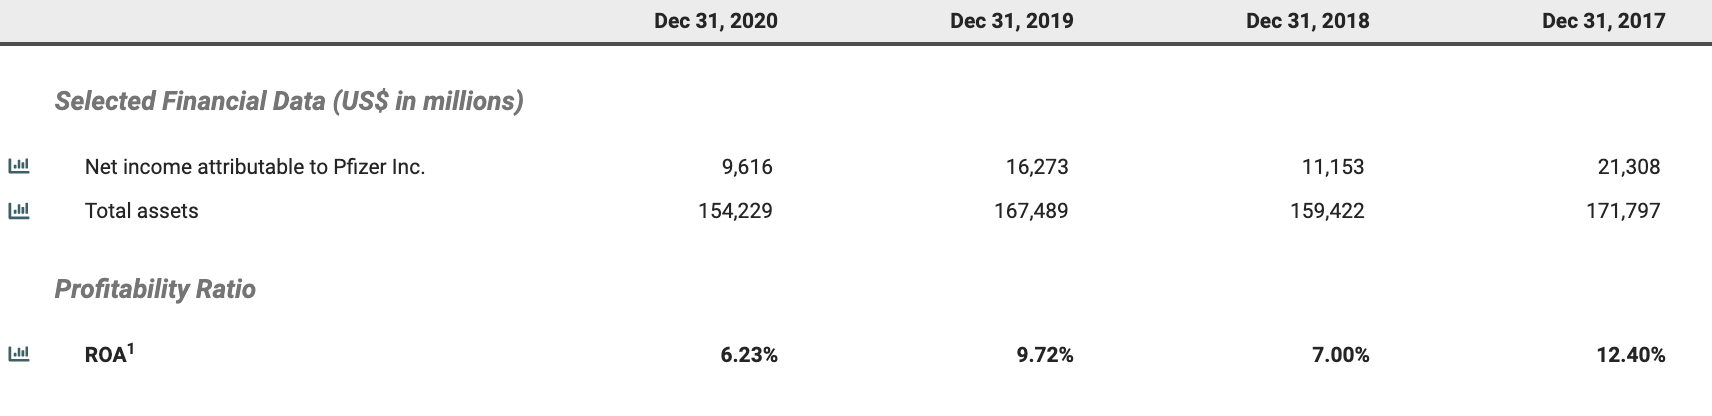
Dec 31, 2020 Dec 31, 2019 Dec 31, 2018 Dec 31, 2017 Return on Sales 79.26% 80.25% 79.03% 78.61% del Gross profit margin Operating profit margin Net profit margin 19.47% 25.46% 26.10% 25.92% .1 22.95% 31.45% 20.79% 40.55% Return on Investment | lil Return on equity (ROE) 15.21% 25.77% 17.59% 29.88% | lil Return on assets (ROA) 6.23% 9.72% 7.00% 12.40% Based on: 10-K (filing date: 2021-02-25), 10-K (filing date: 2020-02-27), 10-K (filing date: 2019-02-28), 10-K (filing date: 2018-02-22), 10-K (filing date: 2017-02-23). Dec 31, 2020 Dec 31, 2019 Dec 31, 2018 Dec 31, 2017 Selected Financial Data (US$ in millions) | Gross profit 33,216 41,531 42,399 41,306 del Revenues 41,908 51,750 53,647 52,546 Profitability Ratio | lil Gross profit margin' 79.26% 80.25% 79.03% 78.61% Dec 31, 2020 Dec 31, 2019 Dec 31, 2018 Dec 31, 2017 Selected Financial Data (US$ in millions) ll[ Operating income 8,160 13,174 14,001 13,620 .1 Revenues 41,908 51,750 53,647 52,546 Profitability Ratio | lil Operating profit margin 19.47% 25.46% 26.10% 25.92% Benchmarks Dec 31, 2020 Dec 31, 2019 Dec 31, 2018 Dec 31, 2017 Selected Financial Data (US$ in millions) Net income attributable to Pfizer Inc. 9,616 16,273 11,153 21,308 lil Revenues 41,908 51,750 53,647 52,546 Profitability Ratio .lol Net profit margin 22.95% 31.45% 20.79% 40.55% Dec 31, 2020 Dec 31, 2019 Dec 31, 2018 Dec 31, 2017 Selected Financial Data (US$ in millions) tul Net income attributable to Pfizer Inc. 9,616 16,273 11,153 21,308 .lol Total Pfizer Inc. shareholders' equity 63,238 63,143 63,407 71,308 Profitability Ratio E ROE1 15.21% 25.77% 17.59% 29.88% Dec 31, 2020 Dec 31, 2019 Dec 31, 2018 Dec 31, 2017 Selected Financial Data (US$ in millions) l.lol Net income attributable to Pfizer Inc. 9,616 16,273 11,153 21,308 ll | Total assets 154,229 167,489 159,422 171,797 Profitability Ratio ROA 6.23% 9.72% 7.00% 12.40%Step by Step Solution
There are 3 Steps involved in it
Step: 1

Get Instant Access to Expert-Tailored Solutions
See step-by-step solutions with expert insights and AI powered tools for academic success
Step: 2

Step: 3
Ace Your Homework with AI
Get the answers you need in no time with our AI-driven, step-by-step assistance
Get Started
Managerial Accounting Special Edition For California State University Los Angeles
Authors: Garrison
14th Edition
0077519973, 978-0077519971