Answered step by step
Verified Expert Solution
Question
1 Approved Answer
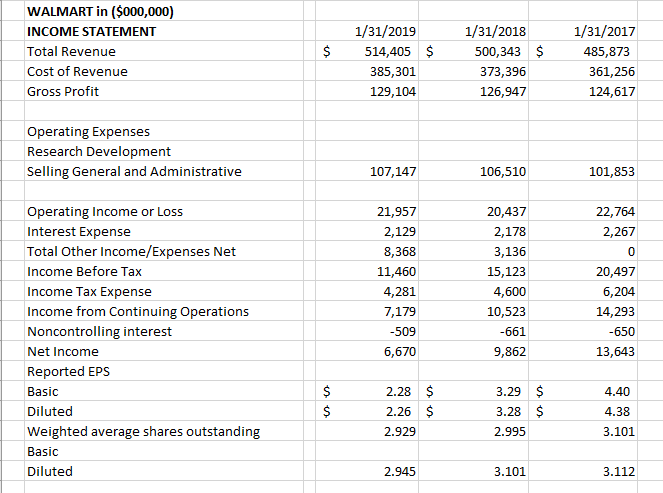
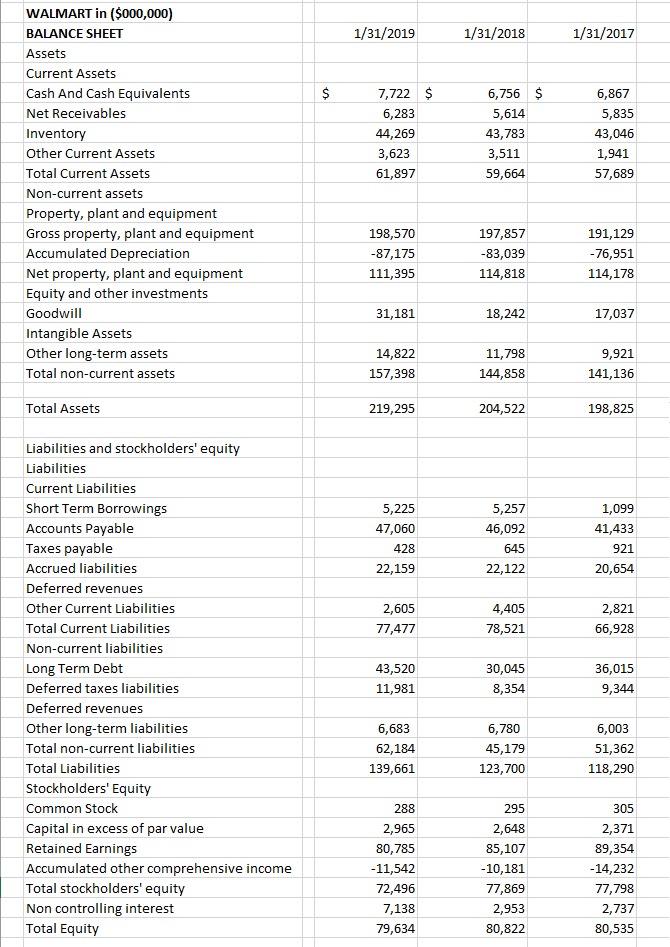
Using the DuPont Multiplier Model to analyze and compare financial performance. Walmart Analysis: Please do excel work and show calculations in details 1/31/2019 1/31/2018 1/31/2017
Using the DuPont Multiplier Model to analyze and compare financial performance.


Walmart Analysis: Please do excel work and show calculations in details
|
| 1/31/2019 | 1/31/2018 | 1/31/2017 |
| Profit Margin |
|
|
|
| Total Asset Turnover |
|
|
|
| Return on Assets |
|
|
|
| Equity Multiplier |
|
|
|
| Return on Equity |
|
|
|
Explain in terms of the Dupont Model Walmarts Performance over the last 3 years. Pay attention to which Ratios added to or detracted from Walmarts performance changes over the 3 years.
WALMART in ($000,000) INCOME STATEMENT Total Revenue Cost of Revenue Gross Profit $ $ 1/31/2019 514,405 385,301 129,104 1/31/2018 500,343 373,396 126,947 1/31/2017 485,873 361,256 124,617 Operating Expenses Research Development Selling General and Administrative 107,147 106,510 101,853 22,764 2,267 Operating Income or Loss Interest Expense Total Other Income/Expenses Net Income Before Tax Income Tax Expense Income from Continuing Operations Noncontrolling interest Net Income Reported EPS Basic Diluted Weighted average shares outstanding Basic Diluted 21,957 2,129 8,368 11,460 4,281 7,179 -509 6,670 20,437 2,178 3,136 15,123 4,600 10,523 -661 9,862 20,497 6,204 14,293 -650 13,643 2.28 2.26 2.929 $ $ 3.29 3.28 2.995 $ $ 4.40 4.38 3.101 2.945 3.101 3.112 1/31/2019 1/31/2018 1/31/2017 $ 7,722 $ 6,283 44,269 3,623 61,897 6,756 5,614 43,783 3,511 59,664 6,867 5,835 43,046 1,941 57,689 WALMART in ($000,000) BALANCE SHEET Assets Current Assets Cash And Cash Equivalents Net Receivables Inventory Other Current Assets Total Current Assets Non-current assets Property, plant and equipment Gross property, plant and equipment Accumulated Depreciation Net property, plant and equipment Equity and other investments Goodwill Intangible Assets Other long-term assets Total non-current assets 198,570 -87,175 111,395 197,857 -83,039 114,818 191,129 -76,951 114,178 31,181 18,242 17,037 14,822 157,398 11,798 144,858 9,921 141,136 Total Assets 219,295 204,522 198,825 5,225 47,060 428 22,159 5,257 46,092 645 22,122 1,099 41,433 921 20,654 2,605 77,477 4,405 78,521 2,821 66,928 Liabilities and stockholders' equity Liabilities Current Liabilities Short Term Borrowings Accounts Payable Taxes payable Accrued liabilities Deferred revenues Other Current Liabilities Total Current Liabilities Non-current liabilities Long Term Debt Deferred taxes liabilities Deferred revenues Other long-term liabilities Total non-current liabilities Total Liabilities Stockholders' Equity Common Stock Capital in excess of par value Retained Earnings Accumulated other comprehensive income Total stockholders' equity Non controlling interest Total Equity 43,520 11,981 30,045 8,354 36,015 9,344 6,683 62,184 139,661 6,780 45,179 123,700 6,003 51,362 118,290 288 2,965 80,785 -11,542 72,496 7,138 79,634 295 2,648 85,107 -10,181 77,869 2,953 80,822 305 2,371 89,354 -14,232 77,798 2,737 80,535Step by Step Solution
There are 3 Steps involved in it
Step: 1

Get Instant Access to Expert-Tailored Solutions
See step-by-step solutions with expert insights and AI powered tools for academic success
Step: 2

Step: 3

Ace Your Homework with AI
Get the answers you need in no time with our AI-driven, step-by-step assistance
Get Started


