- Using the earnings capitalization approach to determine fair value, what is the intrinsic value of Johnson & Johnsons stock in 2012:
- $92.70
- $65.41
- $60.96
- $60.62
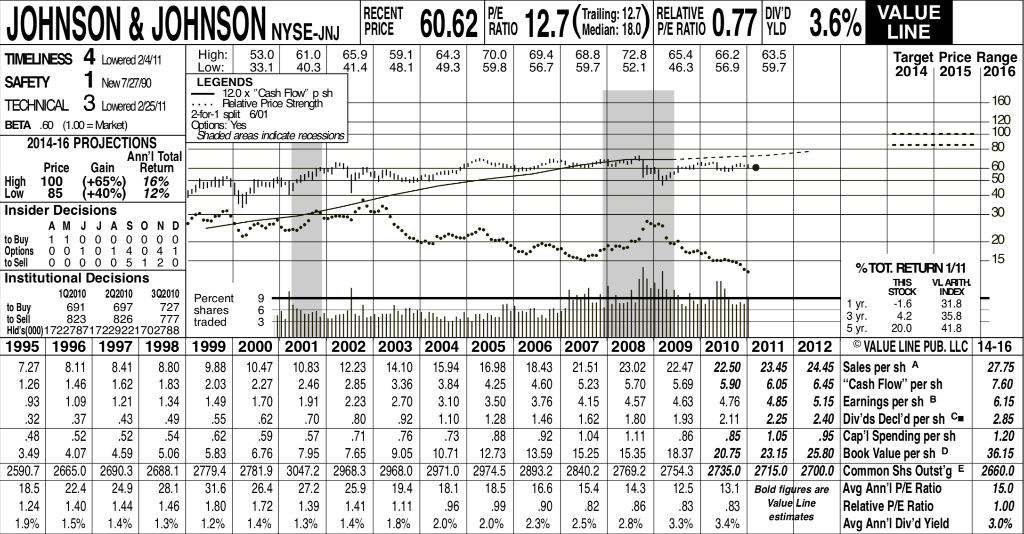
JOHNSON & JOHNSON NYSE-JNU u/ Hit RECENT TrailingRELATIVE DIV'D VALUE JNJ PRICE YLD LINE TIMELINESS 4 Lovered 24/11 High: 53.0 61.0 65.9 59.1 64.3 70.0 69.4 68.8 72.8 65.4 66.2 63.5 Target Price Range Low: 33.1 40.3 41.4 48.1 49.3 59.8 56.7 59.7 52.1 46.3 56.9 59.7 2014 2015 2016 SAFETY 1 New 7/27190 LEGENDS 120 x "Cash Flow" p sh TECHNICAL 3 Lowered 2/25/11 Pelative Price Strength - 160 2-for-1 split 6/01 BETA .60 (1.00 = Market) Options: Yes -120 Shaded areas indicate recessions 100 2014-16 PROJECTIONS 80 Ann'l Total Price Gain Return 60 High 100 (+65%) 16% 50 Low 85 (+40%) 12% 40 Insider Decisions -30 A M J J A S O N D to Buy 1 10OOOOOO -20 Options 0 0 1 0 1 4 0 4 1 to Sell 0 0 0 0 0 5 1 2 0 15 Institutional Decisions % TOT. RETURN 1/11 THS VL ARTH. 102010202010 302010 Percent 9 STOCK INDEX to Buy 691 697 -1.6 1 yr. 31.8 6 to Sell 823 826 777 traded 3 yr. 4.2 35.8 Hid's(000)1 72278717229221702788 5 yr. 20.0 41.8 1995 1996 1997 1998 1999 2000 2001 2002 2003 2004 2005 2006 2007 2008 2009 2010 2011 2012 VALUE LINE PUB. LLC 14-16 7.27 8.11 8.41 8.80 9.88 10.47 10.83 12.23 14.10 15.94 16.98 18.43 21.51 23.02 22.47 22.50 23.45 24.45 Sales per sh A 27.75 1.26 1.46 1.62 1.83 2.03 2.27 2.46 2.85 3.36 3.84 4.25 4.60 5.23 5.70 5.69 5.90 6.05 6.45 "Cash Flow" per sh 7.60 .93 1.09 1.21 1.34 1.49 1.70 1.91 2.23 2.70 3.10 3.50 3.76 4.15 4.57 4.63 4.76 4.85 5.15 Earnings per sh B 6.15 .32 37 .43 .49 .55 .62 .70 , .80 .92 1.10 1.28 1.46 1.62 1.80 1.93 2.11 2.25 2.40 Div'ds Decld per sh C 2.85 .48 52 .52 .54 .62 .59 .57 .71 .76 .73 .88 92 1.04 1.11 .86 .85 1.05 .95 Cap'l Spending per sh 1.20 3.49 4.07 4.59 5.06 5.83 6.76 7.95 7.65 9.05 10.71 12.73 13.59 15.25 15.35 18.37 20.75 23.15 25.80 Book Value per shD 36.15 2590.7 2665.0 2690.3 2688.1 2779.4 2781.9 3047.2 2968.3 29680 2971.0 2974.5 2893.2 2840.2 2769.2 2754.3 2735.0 2715.0 2700.0 Common Shs Outst'g 2660.0 18.5 22.4 24.9 28.1 31.6 26.4 27.2 25.9 19.4 18.1 18.5 16.6 15.4 14.3 12.5 13.1 Bold figures are Avg Ann' P/E Ratio 15.0 1.24 1.40 1.44 1.46 1.80 1.72 1.39 1.41 1.11 .96 .99 .90 .82 .86 .83 .83 Value Line Relative P/E Ratio 1.00 1.9% 1.5% 1.4% 1.3% 1.2% 1.4% 1.3% 1.4% 1.8% 2.0% 2.0% 2.3% 2.5% estimates 2.8% 3.3% 3.4% Avg Ann'l Div'd Yield 3.0% 727 shares E JOHNSON & JOHNSON NYSE-JNU u/ Hit RECENT TrailingRELATIVE DIV'D VALUE JNJ PRICE YLD LINE TIMELINESS 4 Lovered 24/11 High: 53.0 61.0 65.9 59.1 64.3 70.0 69.4 68.8 72.8 65.4 66.2 63.5 Target Price Range Low: 33.1 40.3 41.4 48.1 49.3 59.8 56.7 59.7 52.1 46.3 56.9 59.7 2014 2015 2016 SAFETY 1 New 7/27190 LEGENDS 120 x "Cash Flow" p sh TECHNICAL 3 Lowered 2/25/11 Pelative Price Strength - 160 2-for-1 split 6/01 BETA .60 (1.00 = Market) Options: Yes -120 Shaded areas indicate recessions 100 2014-16 PROJECTIONS 80 Ann'l Total Price Gain Return 60 High 100 (+65%) 16% 50 Low 85 (+40%) 12% 40 Insider Decisions -30 A M J J A S O N D to Buy 1 10OOOOOO -20 Options 0 0 1 0 1 4 0 4 1 to Sell 0 0 0 0 0 5 1 2 0 15 Institutional Decisions % TOT. RETURN 1/11 THS VL ARTH. 102010202010 302010 Percent 9 STOCK INDEX to Buy 691 697 -1.6 1 yr. 31.8 6 to Sell 823 826 777 traded 3 yr. 4.2 35.8 Hid's(000)1 72278717229221702788 5 yr. 20.0 41.8 1995 1996 1997 1998 1999 2000 2001 2002 2003 2004 2005 2006 2007 2008 2009 2010 2011 2012 VALUE LINE PUB. LLC 14-16 7.27 8.11 8.41 8.80 9.88 10.47 10.83 12.23 14.10 15.94 16.98 18.43 21.51 23.02 22.47 22.50 23.45 24.45 Sales per sh A 27.75 1.26 1.46 1.62 1.83 2.03 2.27 2.46 2.85 3.36 3.84 4.25 4.60 5.23 5.70 5.69 5.90 6.05 6.45 "Cash Flow" per sh 7.60 .93 1.09 1.21 1.34 1.49 1.70 1.91 2.23 2.70 3.10 3.50 3.76 4.15 4.57 4.63 4.76 4.85 5.15 Earnings per sh B 6.15 .32 37 .43 .49 .55 .62 .70 , .80 .92 1.10 1.28 1.46 1.62 1.80 1.93 2.11 2.25 2.40 Div'ds Decld per sh C 2.85 .48 52 .52 .54 .62 .59 .57 .71 .76 .73 .88 92 1.04 1.11 .86 .85 1.05 .95 Cap'l Spending per sh 1.20 3.49 4.07 4.59 5.06 5.83 6.76 7.95 7.65 9.05 10.71 12.73 13.59 15.25 15.35 18.37 20.75 23.15 25.80 Book Value per shD 36.15 2590.7 2665.0 2690.3 2688.1 2779.4 2781.9 3047.2 2968.3 29680 2971.0 2974.5 2893.2 2840.2 2769.2 2754.3 2735.0 2715.0 2700.0 Common Shs Outst'g 2660.0 18.5 22.4 24.9 28.1 31.6 26.4 27.2 25.9 19.4 18.1 18.5 16.6 15.4 14.3 12.5 13.1 Bold figures are Avg Ann' P/E Ratio 15.0 1.24 1.40 1.44 1.46 1.80 1.72 1.39 1.41 1.11 .96 .99 .90 .82 .86 .83 .83 Value Line Relative P/E Ratio 1.00 1.9% 1.5% 1.4% 1.3% 1.2% 1.4% 1.3% 1.4% 1.8% 2.0% 2.0% 2.3% 2.5% estimates 2.8% 3.3% 3.4% Avg Ann'l Div'd Yield 3.0% 727 shares E