

Question
Using the equation of your demand, please draw the demand curve for your product with the price on the vertical axis and quantity on the
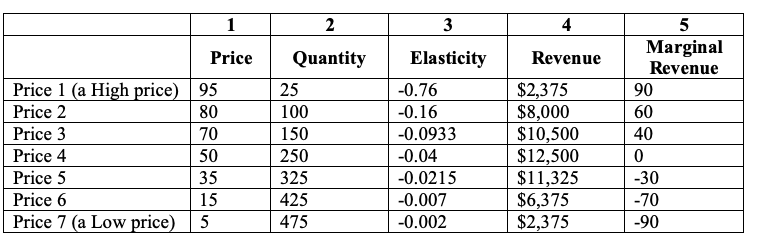
Using the equation of your demand, please draw the demand curve for your product with the price on the vertical axis and quantity on the horizontal axis. Also draw the marginal revenue curve on the same graph. Be sure to properly label each graph. You are asked to draw the demand and marginal revenue curves for your product in its entirety (not only a segment of it).
my demand equation is P = 100 - 0.2Q, How would I make a graph with different price points and quantity on Excel?
Step by Step Solution
There are 3 Steps involved in it
Step: 1

Get Instant Access to Expert-Tailored Solutions
See step-by-step solutions with expert insights and AI powered tools for academic success
Step: 2

Step: 3
Ace Your Homework with AI
Get the answers you need in no time with our AI-driven, step-by-step assistance
Get Started
Intermediate Microeconomics and Its Application
Authors: walter nicholson, christopher snyder
11th edition
9781111784300, 324599102, 1111784302, 978-0324599107