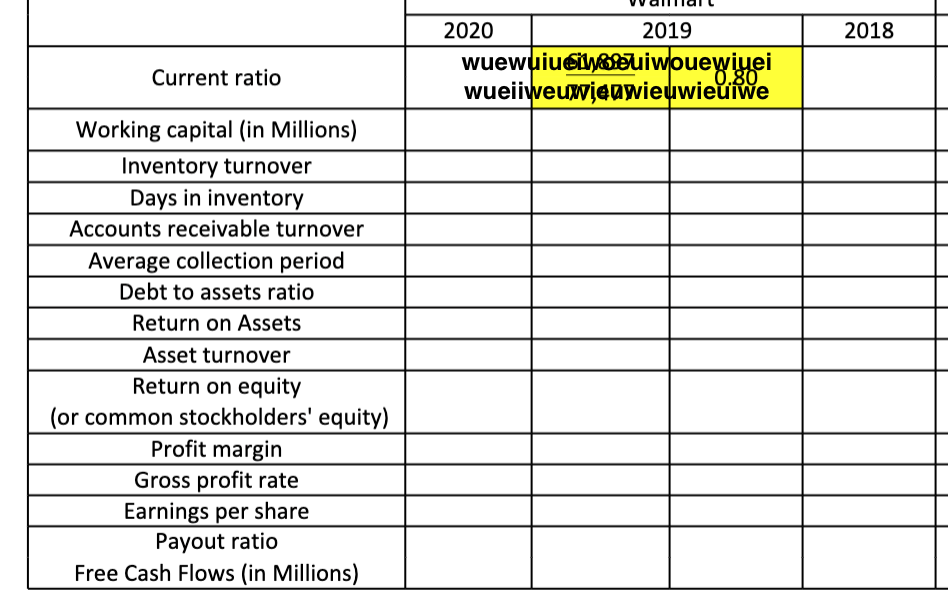
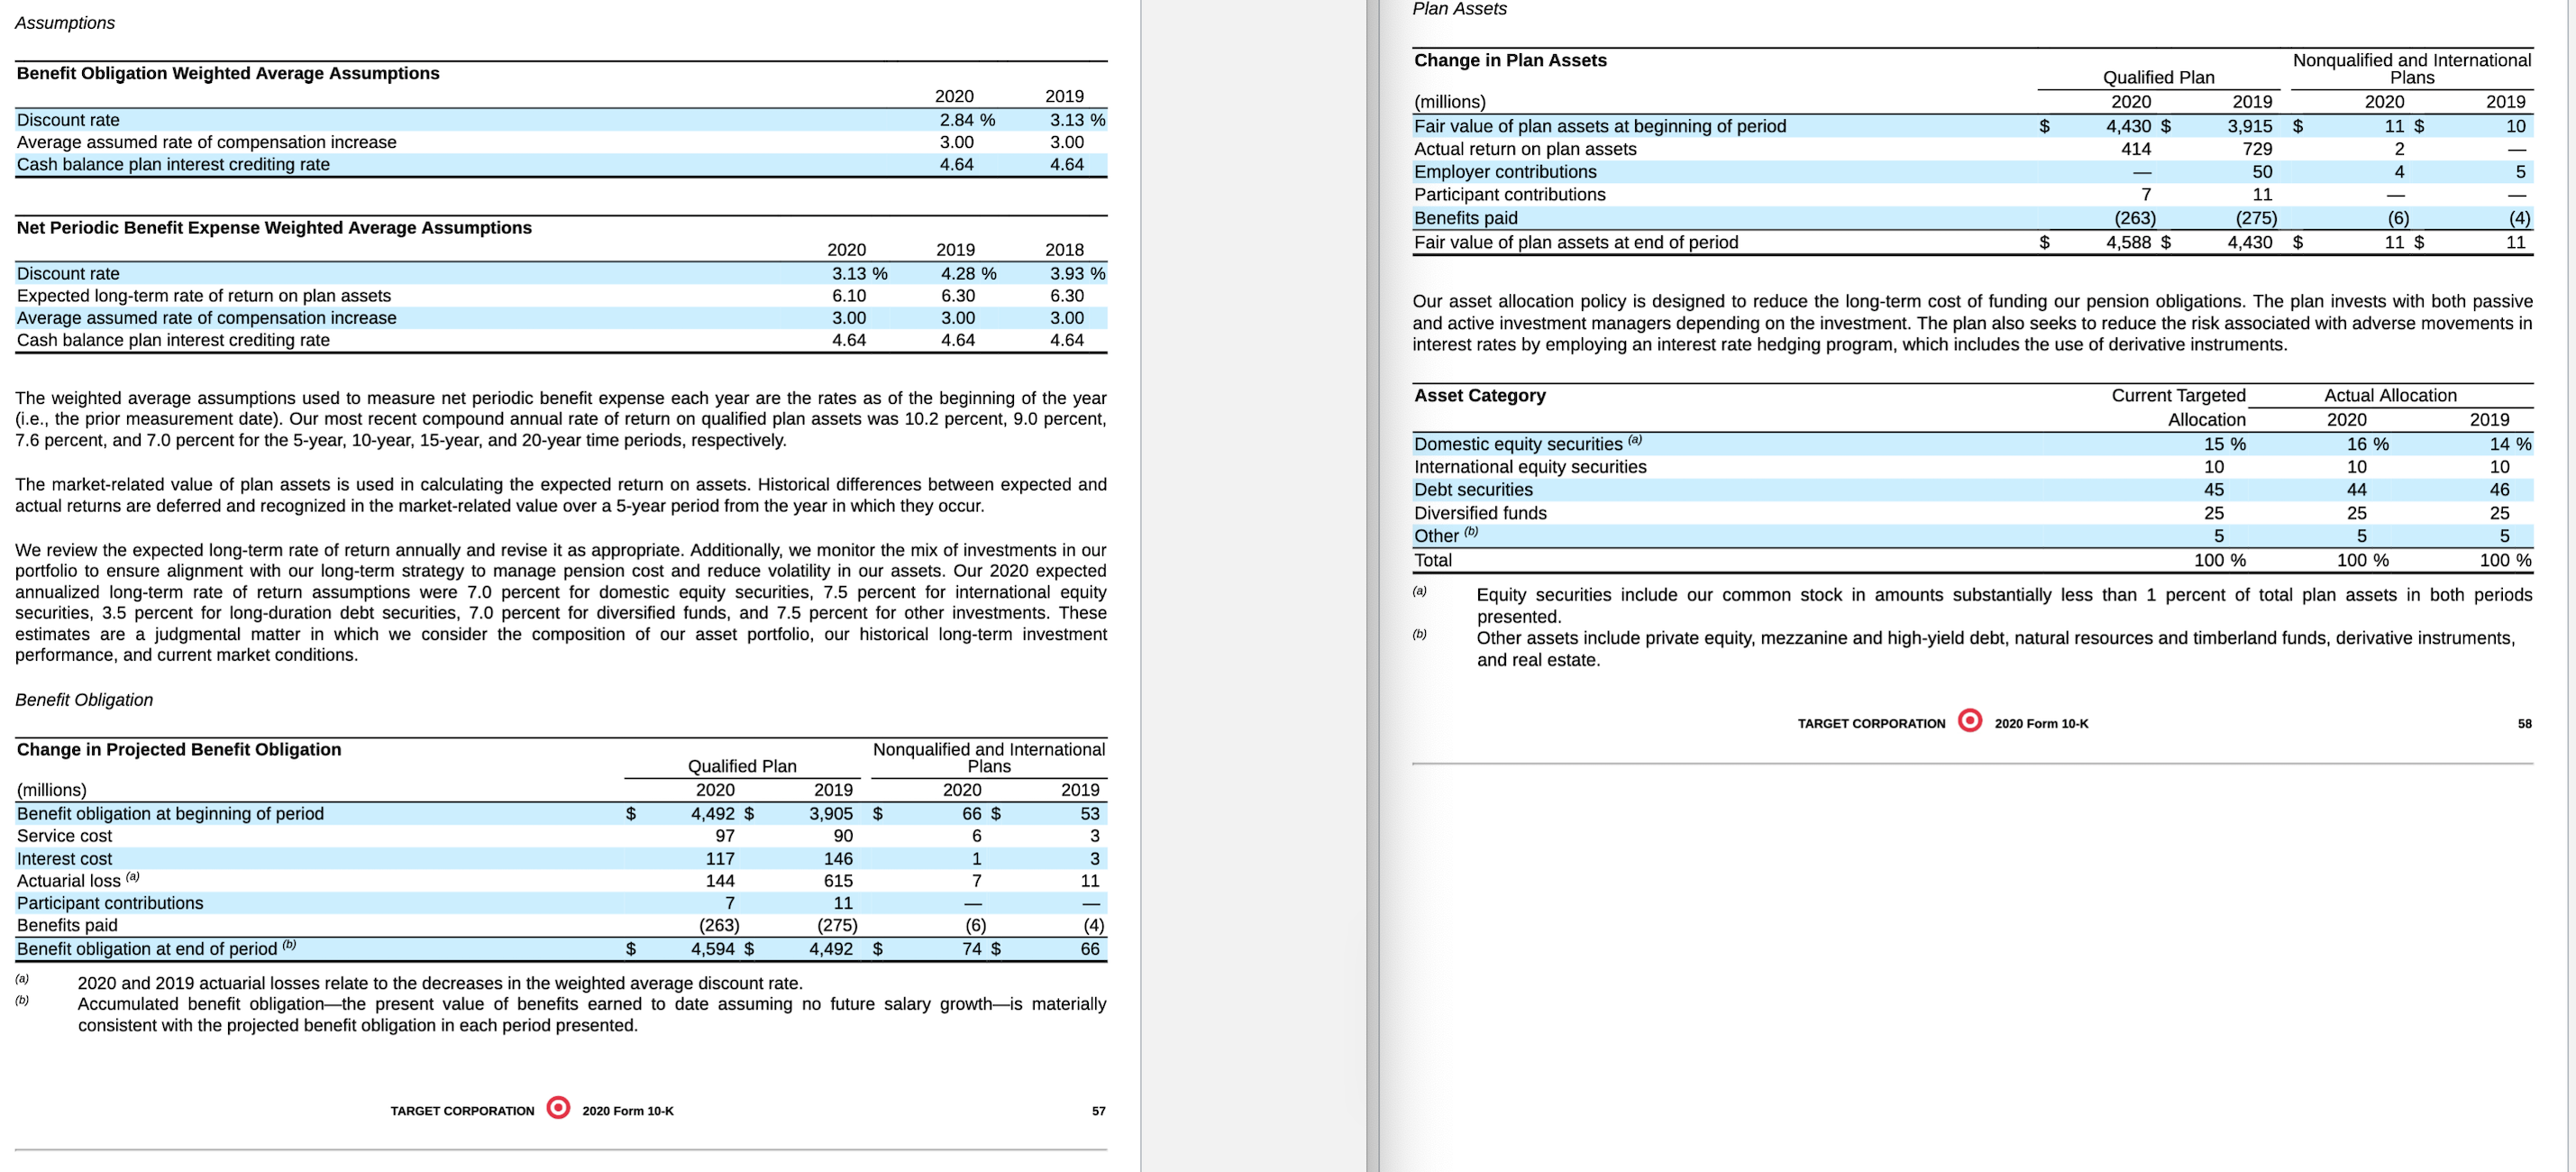
Question: Using the excel template, Calculate various ratios to evaluate Target's financial position, operational efficiency, profitability, and its competitor, Target, for the fiscal years ending 2018,
Using the excel template, Calculate various ratios to evaluate Target's financial position, operational efficiency,
profitability, and its competitor, Target, for the fiscal years ending 2018, 2019, and 2020.
Find the relevant chapters to see how to calculate each ratio.
o Show your work for each ratio calculation to get credit. See the example in the template.
o Round up your calculation to two decimal points except for working capital and free cash
flows. Round to the nearest millions for working capital and free cash flows.
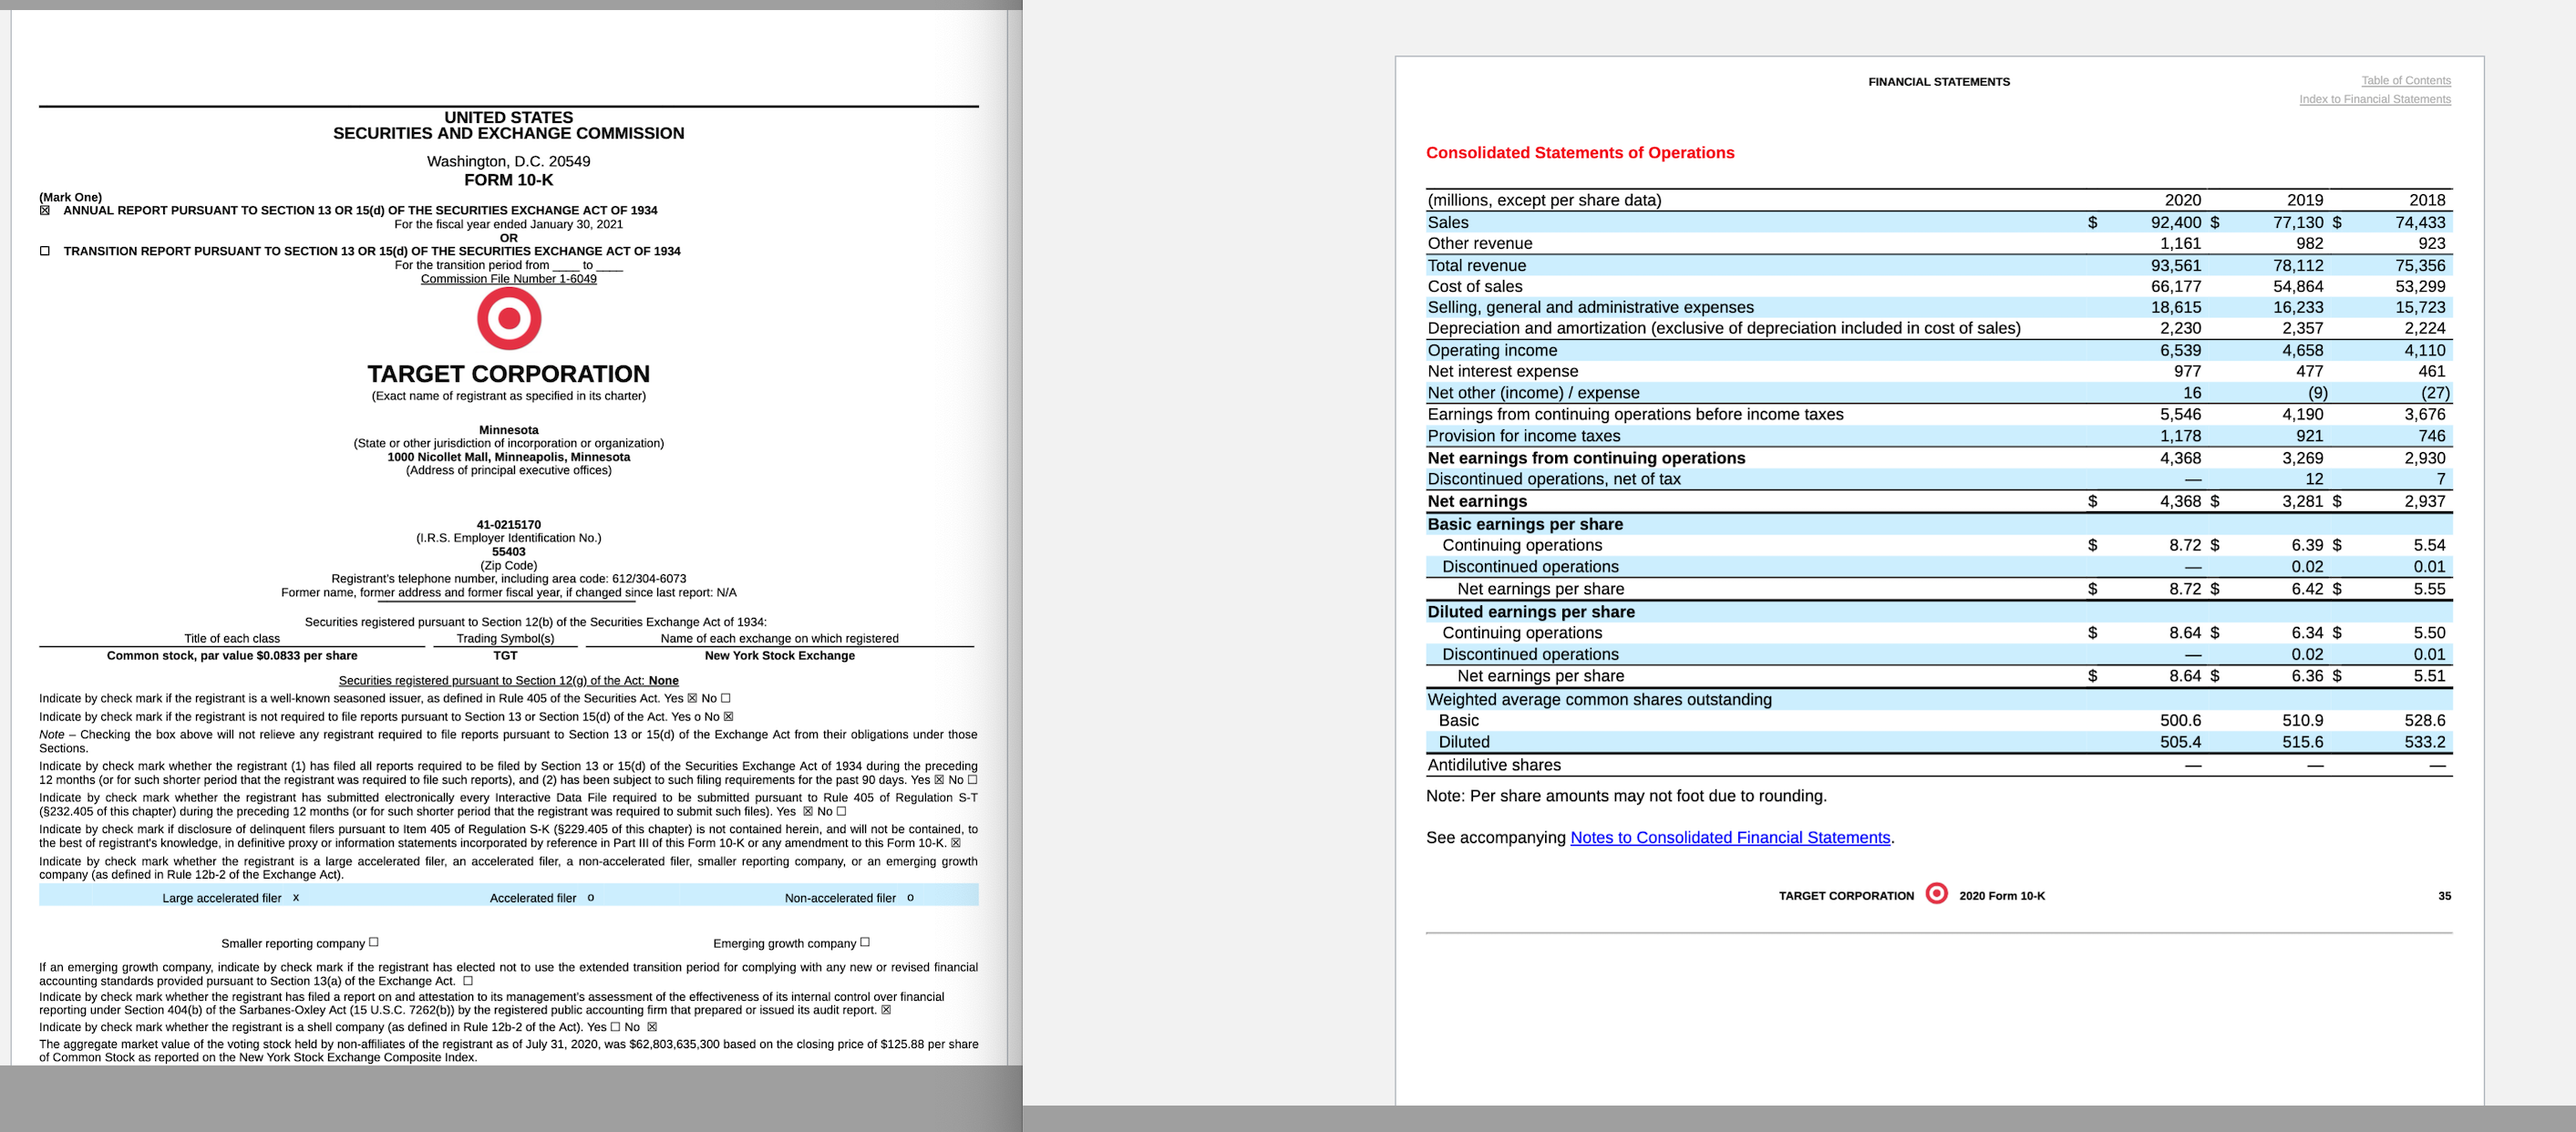
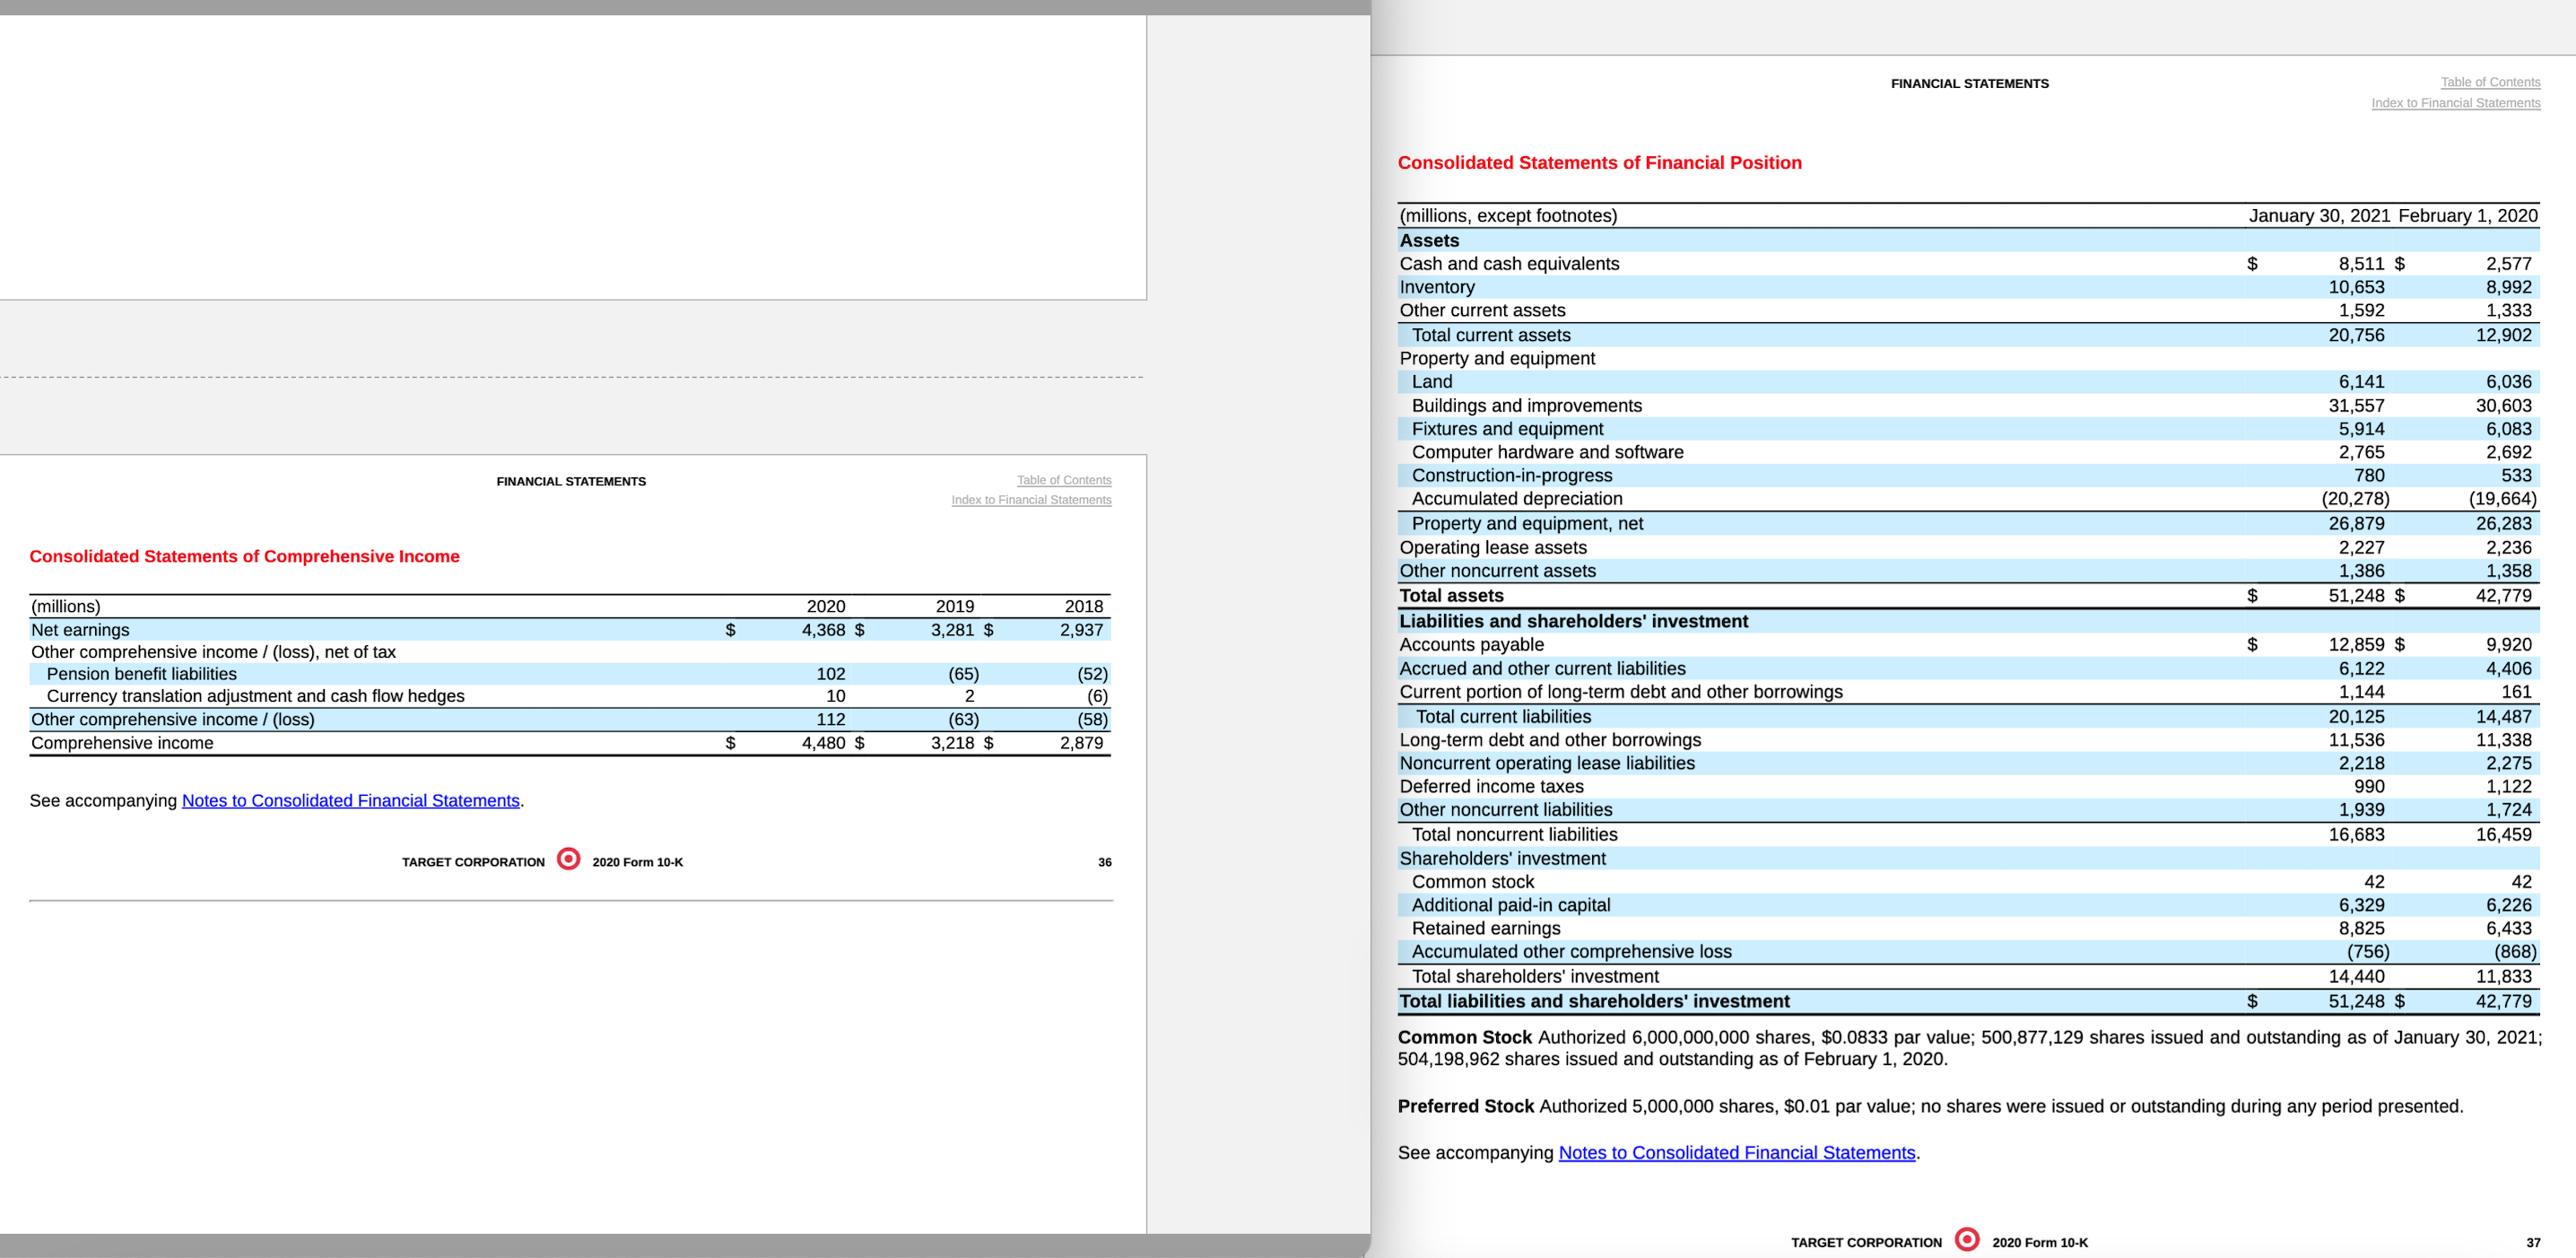
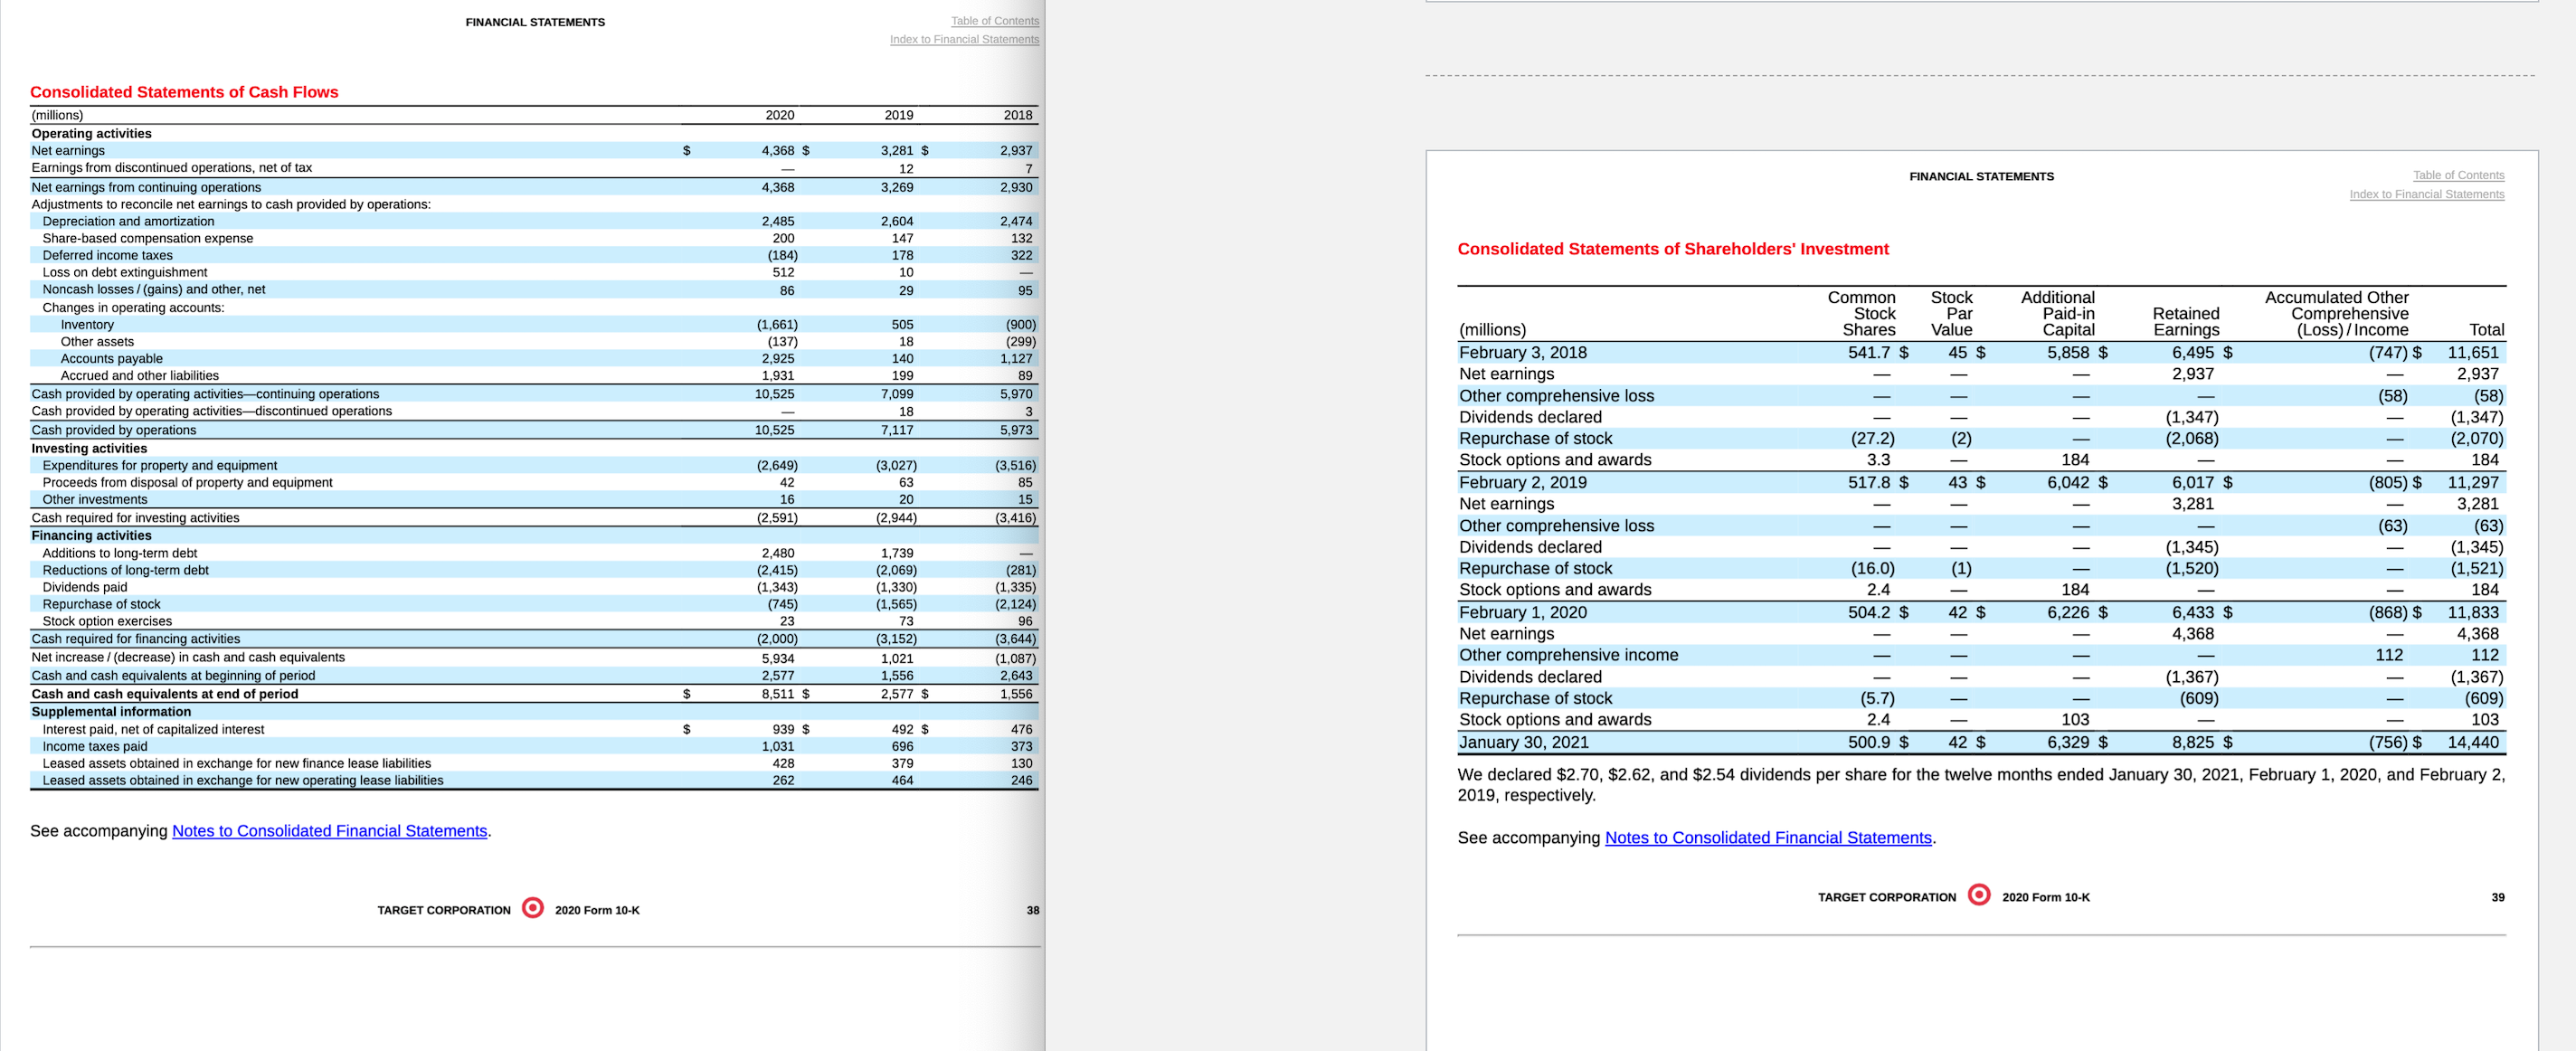
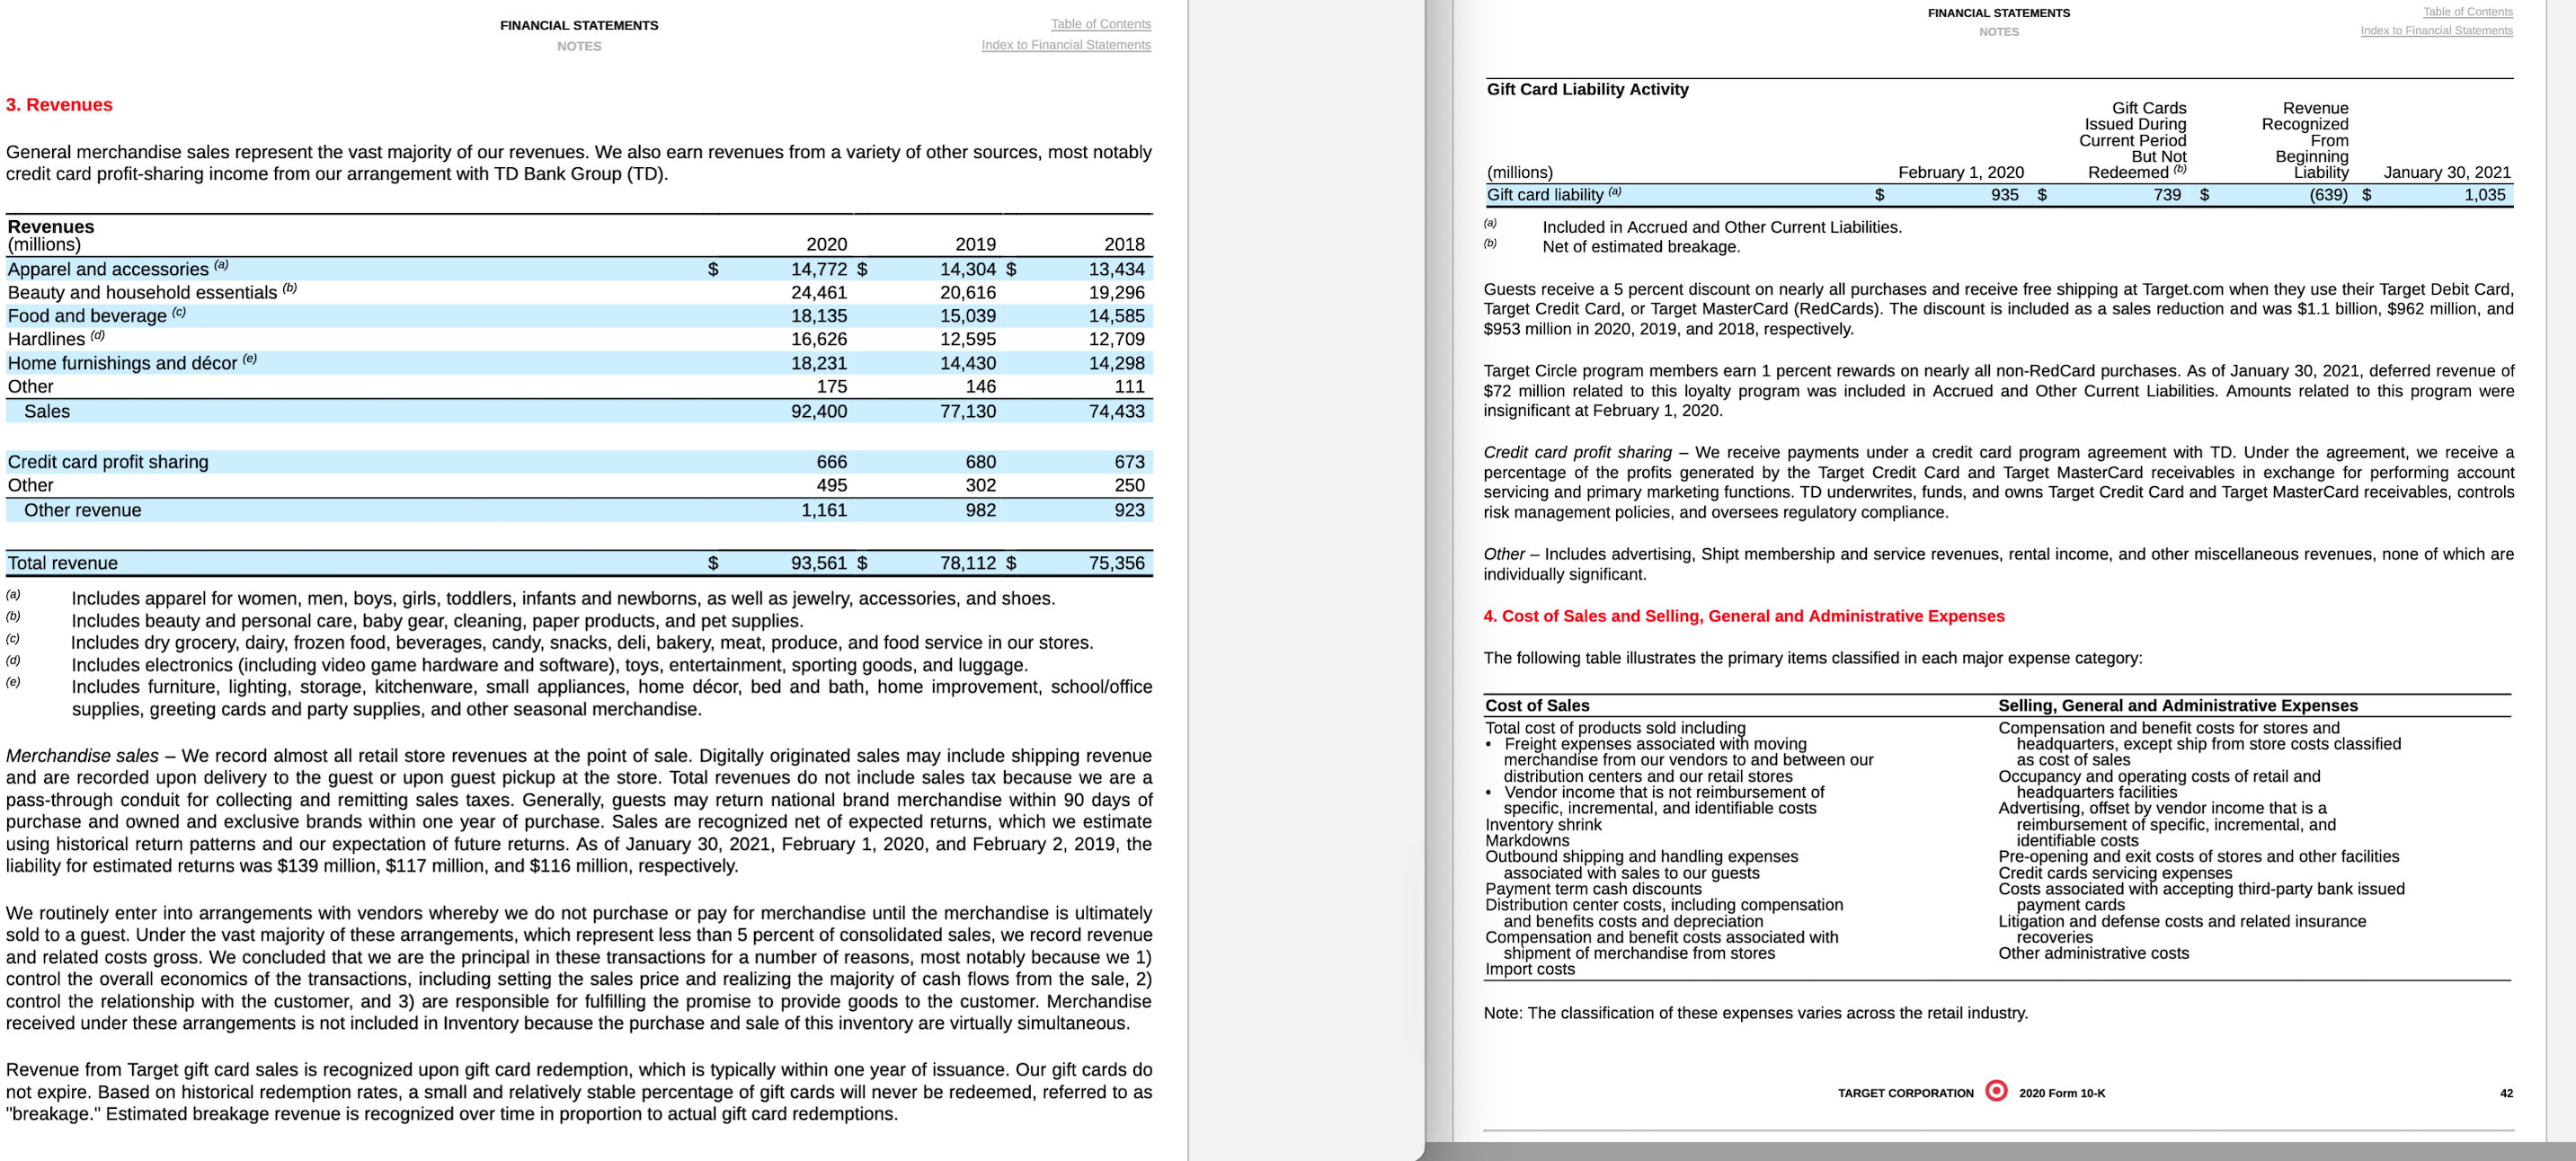
'Illlll I. mE-_- ____ Days in inventory ____ Accounts receivable turnover ___ Average collection period ____ Debt to assets ratio ____ Return on Assets ___ ____ Return on equity (or common stockholders' equity) ____ ____ ____ Payout ratio Free Cash Flows (in Millions) FINANCIAL STATEMENTS Table of Contents Index to Financial Statements UNITED STATES SECURITIES AND EXCHANGE COMMISSION Washington, D.C. 20549 Consolidated Statements of Operations FORM 10-K (Mark One) ANNUAL REPORT PURSUANT TO SECTION 13 OR 15(d) OF THE SECURITIES EXCHANGE ACT OF 1934 (millions, except per share data) 2020 2019 2018 For the fiscal year ended January 30, 2021 Sales $ 92,400 $ 7,130 $ 74,433 TRANSITION REPORT PURSUANT TO SECTION 13 OR 15(d) OF THE SECURITIES EXCHANGE ACT OF 1934 Other revenue 1,161 982 923 For the transition period from _to Total revenue 93,561 78,112 75,356 Commission File Number 1-6049 Cost of sales 66,177 54,864 53,29 O Selling, general and administrative expenses 18,615 16,233 15,723 ion and amortization (exclusive of depreciation included in cost of sales) 2,230 2,357 2,224 Operating income 6,539 4.658 4,110 TARGET CORPORATION Net interest expense 977 477 461 (Exact name of registrant as specified in its charter) Net other (income) / expense 16 (9 (27) Earnings from continuing operations before income taxes 5,546 4,190 3,676 Minnesota (State or other jurisdiction of i 1,178 921 746 diction of incorporation or organization) Provision for income taxes 1000 Nicollet Mall, Minneapolis, Minnesota Net earnings from continuing operations 4,368 3,269 2,930 (Address of principal executive offices) Discontinued operations, net of tax 12 Net earnings $ 4,368 $ 3,281 $ 2,937 41-0215170 Basic earnings per share (1.R.S. Employer Identification No.) Continuing operations $ 8.72 $ 6.39 $ 5.54 (Zip Code) Discontinued operations 0.02 0.01 Registrant's telephone number, including area code: 612/304-6073 Former name, former address and former fiscal year, if changed since last report: N/A Net earnings per share $ 8.72 $ 6.42 $ 5.55 Diluted earnings per share Securities registered pursuant to Section 12(b) of the Securities Exchange Act of 1934: Title of each class Trading Symbol(S) Name of each exchange on which registered Continuing operations $ 8.64 $ 6.34 $ 5.50 Common stock, par value $0.0833 per share TGT New York Stock Exchange Discontinued operations 0.02 0.01 Securities registered pursuant to Section 12(g) of the Act: None Net earnings per share 8.64 $ 5.36 $ 5.51 Indicate by check mark if the registrant is a well-known seasoned issuer, as defined in Rule 405 of the Securities Act. Yes X No O Weighted average common shares outstanding Indicate by check mark if the registrant is not required to file reports pursuant to Section 13 or Section 15(d) of the Act. Yes o No X Basic 500.6 510.9 528.6 Note - Checking the box above will not relieve any registrar Section 13 or 15(d) of the Exchange Act from their obligations under those 505.4 515.6 Sections. Diluted 533.2 Indicate by check mark whether the registrant (1) has filed all reports required to be filed by Section 13 or 15(d) of the Securities Exchange Act of 1934 during the preceding Antidilutive shares 12 months (or for such shorter period that the registrant was required to file such reports), and (2) has been subject to such filing requirements for the past 90 days. Yes X No D Indicate by check mark whether the registrant has submitted electronically every Interactive Data File required to be submitted pursuant to Rule 405 of Regulation S-T Note: Per share amounts may not foot due to rounding. (5232.405 of this chapter) during the preceding 12 months (or for such shorter period that the registrant was required to submit such files). Yes " No Indicate by check mark if disclosure of delinquent filers pursuant to Item 405 of Regulation S-K ($229.405 of this chapter) is not contained herein, and will not be contained, to the best of registrant's knowledge, in definitive proxy or information statements incorporated by reference in Part III of this Form 10-K or any amendment to this Form 10-K. X See accompanying Notes to Consolidated Financial Statements. Indicate by check mark whether the registrant is a large accelerated filer, accelerated filer, smaller reporting company, or an emerging growth company (as defined in Rule 12b-2 of the Exchange Act). Large accelerated filer > Accelerated filer o Non-accelerated filer o TARGET CORPORATION O 2020 Form 10-K Smaller reporting company Emerging growth company If an emerging growth company, indicate by check mark if the registrant has elected not to use the extended transition period for complying with any new or revised financial accounting standards provided pursuant to Section 13(a) of the Exchange Act. Indicate by check mark whether the registrant has filed a report on and attestation to its management's assessment of the effectiveness of its internal control over financial reporting under Section 404(b) of the Sarbanes-Oxley Act (15 U.S.C. 7262(b)) by the registered public accounting firm that prepared or issued its audit report. X Indicate by check mark whether the registrant is a shell company (as defined in Rule 12b-2 of the Act). Yes ( No x The aggregate market value of the voting stock held by non-affiliates of the registrant as of July 31, 2020, was $62,803,635,300 based on the closing price of $125.88 per share of Common Stock as reported on the New York Stock Exchange Composite Index.FINANCIAL STATEMENTS Table of Contents Index to Financial Statements Consolidated Statements of Financial Position (millions, except footnotes) January 30, 2021 February 1, 2020 Assets Cash and cash equivalents $ 8,511 $ 2,577 Inventory 10,653 8,992 Other current assets 1,592 1,333 Total current assets 20,756 12,902 Property and equipment Land 6,141 6,036 Buildings and improvements 31,557 30,603 Fixtures and equipment 5,914 6,083 Computer hardware and software 2.765 2,692 533 FINANCIAL STATEMENTS Table of Contents Construction-in-progress 78 Index to Financial Statements Accumulated depreciation (20,278 (19,664) Property and equipment, net 26,879 26,283 Consolidated Statements of Comprehensive Income Operating lease assets 2,227 2,236 Other noncurrent assets 1,386 1,358 Total assets $ 51,248 $ 42,779 (millions) 2020 2019 2018 Net earnings 4,368 $ 3,281 $ 2,937 Liabilities and shareholders' investment $ Other comprehensive income / (loss), net of tax Accounts payable $ 12,859 $ 9,920 Accrued and other current liabilities 6,122 4,406 Pension benefit liabilities 102 (65) (52) 161 Currency translation adjustment and cash flow hedges 10 (6) Current portion of long-term debt and other borrowings 1,144 Other comprehensive income / (loss) 112 (63) '58) Total current liabilities 20,125 14,487 Comprehensive income $ 4,480 $ 3,218 $ 2,879 Long-term debt and other borrowings 11,536 11,338 Noncurrent operating lease liabilities 2,218 2,275 Deferred income taxes 990 1,122 See accompanying Notes to Consolidated Financial Statements. Other noncurrent liabilities 1,939 1,724 Total noncurrent liabilities 16,683 16,459 TARGET CORPORATION 2020 Form 10-K Shareholders' investment Common stock 42 42 Additional paid-in capital 6,329 6,226 Retained earnings 8,825 5.43 Accumulated other comprehensive loss (756) (868) Total shareholders' investment 14,440 11,833 Total liabilities and shareholders' investment $ 51,248 $ 42,779 Common Stock Authorized 6,000,000,000 shares, $0.0833 par value; 500,877,129 shares issued and outstanding as of January 30, 2021; 504,198,962 shares issued and outstanding as of February 1, 2020. Preferred Stock Authorized 5,000,000 shares, $0.01 par value; no shares were issued or outstanding during any period presented. See accompanying Notes to Consolidated Financial Statements. TARGET CORPORATION 2020 Form 10-KFINANCIAL STATEMENTS Table of Contents Index to Financial Statements Consolidated Statements of Cash Flows (millions) 2020 2019 2018 Operating activities Net earnings 4,368 $ 3,281 $ 2,937 Earnings from discontinued operations, net of tax 12 7 Net earnings from continuing operations 4,368 3,269 2,930 FINANCIAL STATEMENTS Table of Contents Adjustments to reconcile net earnings to cash provided by operations: Index to Financial Statements Depreciation and amortization 2,485 2,604 2.474 Share-based compensation expense 200 147 132 Deferred income taxes (184) 178 322 Consolidated Statements of Shareholders' Investment Loss on debt extinguishment 512 10 Noncash losses / (gains) and other, net 86 20 95 Commor Stock Additiona Accumulated Other Changes in operating accounts: (1,661) Stock Pa Paid-in Inventory (900) Retained Comprehensive 505 (millions) shares Value Capital (137) (299) Earnings (Loss) / Income Total Other assets 18 Accounts payable 2,925 140 1.127 February 3, 2018 541.7 $ 45 5,858 $ 5,495 $ 747) $ 11,651 Accrued and other liabilities 1,931 199 89 Net earnings 2,937 2,937 Cash provided by operating activities-continuing operations 10,525 099 5.970 Other comprehensive loss (58 (58) Cash provided by operating activities-discontinued operations 18 Dividends declared (1,347 (1,347) Cash provided by operations 10,525 7,117 5,973 Investing activities Repurchase of stock 27.2 ( 2 ) (2,068 (2,070) Expenditures for property and equipment (2,649) (3,027) (3,516) Stock options and awards 3.3 184 184 Proceeds from disposal of property and equipment 42 63 85 February 2, 2019 517.8 $ 43 $ 6,042 $ 6,017 $ (805) $ 11,297 Other investments 16 20 15 Net earnings 3,281 3,281 Cash required for investing activities "2,591) (2,944) (3,416) Other comprehensive loss (63 (63) Financing activities Additions to long-term debt 2.480 1,739 Dividends declared (1,345) (1,345) Reductions of long-term debt (2,415) (2,069) (281) Repurchase of stock (16.0) (1) (1,520 1,521 Dividends paid (1,343) (1,330) (1,335) Stock options and awards 2.4 184 184 Repurchase of stock (745) (1,565) 2,124) Stock option exercises 23 73 February 1, 2020 504.2 $ 42 $ ,226 $ 6,433 $ (868) $ 11,833 Cash required for financing activities (2,000) (3,152) (3,644) Net earnings 4,368 4,368 Net increase / (decrease) in cash and cash equivalents 5,934 1,021 (1,087) Other comprehensive income 112 112 Cash and cash equivalents at beginning of period 2,577 1,556 2,643 Dividends declared (1,367) 1,367 Cash and cash equivalents at end of period 8,511 $ 2,577 $ 1,556 Repurchase of stock 5.7) (609) (609) Supplemental information 2.4 939 103 Interest paid, net of capitalized interest 103 492 $ Stock options and awards 476 Income taxes paid 1,031 696 373 January 30, 2021 500.9 $ 42 $ 6,329 $ 8,825 $ (756) $ 14,440 Leased assets obtained in exchange for new finance lease liabilities 428 379 130 Leased assets obtained in exchange for new operating lease liabilities 262 464 246 We declared $2.70, $2.62, and $2.54 dividends per share for the twelve months ended January 30, 2021, February 1, 2020, and February 2, 2019, respectively. See accompanying Notes to Consolidated Financial Statements. See accompanying Notes to Consolidated Financial Statements. TARGET CORPORATION 2020 Form 10-K TARGET CORPORATION O 2020 Form 10-KFINANCIAL STATEMENTS Table of Contents FINANCIAL STATEMENTS Table of Contents NOTES Index to Financial Statements NOTES Index to Financial Statements Gift Card Liability Activity 3. Revenues Gift Cards Revenue Issued During Recognized Current Period From General merchandise sales represent the vast majority of our revenues. We also earn revenues from a variety of other sources, most notably But Not Beginning credit card profit-sharing income from our arrangement with TD Bank Group (TD). (millions) February 1, 2020 Redeemed () Liability January 30, 2021 Gift card liability (a) 935 $ 739 $ (639) $ 1,035 Revenues (a) Included in Accrued and Other Current Liabilities. (millions) 2020 2019 2018 ( b ) Net of estimated breakage. Apparel and accessories (a) $ 14,772 $ 14,304 $ 13,434 Beauty and household essentials (b) 24,461 20,616 19,296 Guests receive a 5 percent discount on nearly all purchases and receive free shipping at Target.com when they use their Target Debit Card, Food and beverage ( 18,135 15,039 14,585 Target Credit Card, or Target MasterCard (RedCards). The discount is included as a sales reduction and was $1.1 billion, $962 million, and Hardlines d) 16,626 12,595 12,709 $953 million in 2020, 2019, and 2018, respectively. Home furnishings and decor () 18,231 14,430 14,298 Target Circle program members earn 1 percent rewards on nearly all non-RedCard purchases. As of January 30, 2021, deferred revenue of Other 175 146 111 $72 million related to this loyalty program was included in Accrued and Other Current Liabilities. Amounts related to this program were Sales 92,400 77,130 74,433 insignificant at February 1, 2020. Credit card profit sharing 666 680 673 Credit card profit sharing - We receive payments under a credit card program agreement with TD. Under the agreement, we receive a Other 495 302 250 percentage of the profits generated by the Target Credit Card and Target MasterCard receivables in exchange for performing account servicing and primary marketing functions. TD underwrites, funds, and owns Target Credit Card and Target MasterCard receivables, controls Other revenue 1,161 982 923 risk management policies, and oversees regulatory compliance. Total revenue $ 93,561 $ 78,112 $ 5,356 Other - Includes advertising, Shipt membership and service revenues, rental income, and other miscellaneous revenues, none of which are individually significant. Includes apparel for women, men, boys, girls, toddlers, infants and newborns, as well as jewelry, accessories, and shoes. Includes beauty and personal care, baby gear, cleaning, paper products, and pet supplies. 4. Cost of Sales and Selling, General and Administrative Expenses Includes dry grocery, dairy, frozen food, beverages, candy, snacks, deli, bakery, meat, produce, and food service in our stores. Includes electronics (including video game hardware and software), toys, entertainment, sporting goods, and luggage. The following table illustrates the primary items classified in each major expense category: Includes furniture, lighting, storage, kitchenware, small appliances, home decor, bed and bath, home improvement, school/office supplies, greeting cards and party supplies, and other seasonal merchandise. Cost of Sales Selling, General and Administrative Expenses Total cost of products sold including Compensation and benefit costs for stores and Freight expenses associated with moving headquarters, except ship from store costs classified Merchandise sales - We record almost all retail store revenues at the point of sale. Digitally originated sales may include shipping revenue merchandise from our vendors to and between our as cost of sales and are recorded upon delivery to the guest or upon guest pickup at the store. Total revenues do not include sales tax because we are a distribution centers and our retail stores Occupancy and operating costs of retail and pass-through conduit for collecting and remitting sales taxes. Generally, guests may return national brand merchandise within 90 days of Vendor income that is not reimbursement of headquarters facilities specific, incremental, and identifiable costs Advertising, offset by vendor income that is a purchase and owned and exclusive brands within one year of purchase. Sales are recognized net of expected returns, which we estimate Inventory shrink reimbursement of specific, incremental, and using historical return patterns and our expectation of future returns. As of January 30, 2021, February 1, 2020, and February 2, 2019, the Markdowns identifiable costs liability for estimated returns was $139 million, $117 million, and $116 million, respectively. Outbound shipping and handling expenses Pre-opening and exit costs of stores and other facilities associated with sales to our guests Credit cards servicing expenses Payment term cash discounts Costs associated with accepting third-party bank issued We routinely enter into arrangements with vendors whereby we do not purchase or pay for merchandise until the merchandise is ultimately Distribution center costs, including compensation payment cards and benefits costs and depreciation itigation and defense costs and related insurance sold to a guest. Under the vast majority of these arrangements, which represent less than 5 percent of consolidated sales, we record revenue Compensation and benefit costs associated with recoveries and related costs gross. We concluded that we are the principal in these transactions for a number of reasons, most notably because we 1) shipment of merchandise from stores Other administrative costs control the overall economics of the transactions, including setting the sales price and realizing the majority of cash flows from the sale, 2) Import costs control the relationship with the customer, and 3) are responsible for fulfilling the promise to provide goods to the customer. Merchandise received under these arrangements is not included in Inventory because the purchase and sale of this inventory are virtually simultaneous. Note: The classification of these expenses varies across the retail industry. Revenue from Target gift card sales is recognized upon gift card redemption, which is typically within one year of issuance. Our gift cards do not expire. Based on historical redemption rates, a small and relatively stable percentage of gift cards will never be redeemed, referred to as TARGET CORPORATION 2020 Form 10-K breakage." Estimated breakage revenue is recognized over time in proportion to actual gift card redemptionsSignificant Financial Instruments not Measured at Fair Value (2) As of January 30, 2021 As of February 1, 2020 vendors are charged for merchandise shipments that do not meet our requirements (violations), such as late or incomplete shipments. Carrying Fair Carrying Fair Substantially all vendor income is recorded as a reduction of Cost of Sales. (millions) Amount Value Amount Value Long-term debt, including current portion () $ 10,643 $ 12,787 $ 9,992 $ 11,864 We establish a receivable for vendor income that is earned but not yet received. Based on historical trending and data, this receivable is (a) computed by forecasting vendor income collections and estimating the amount earned. The majority of the year-end vendor income The carrying amounts of certain other current assets, commercial paper, accounts payable, and certain accrued and other current receivables are collected within the following fiscal quarter, and we do not believe there is a reasonable likelihood that the assumptions used liabilities approximate fair value due to their short-term nature. in our estimate will change significantly. Note 10 provides additional information. The fair value of debt is generally measured using a discounted cash flow analysis based on current market interest rates for the same or similar types of financial instruments and would be classified as Level 2. These amounts exclude commercial paper, 6. Advertising Costs unamortized swap valuation adjustments, and lease liabilities. Advertising costs, which primarily consist of newspaper circulars, digital advertisements, and media broadcast, are generally expensed at 8. Cash and Cash Equivalents first showing or distribution of the advertisement. Reimbursements from vendors that are for specific, incremental, and identifiable advertising costs are recognized as offsets of these advertising costs within Selling, General and Administrative Expenses (SG&A Expenses). Net Cash equivalents include highly liquid investments with an original maturity of three months or less from the time of purchase. Cash advertising costs were $1.5 billion, $1.6 billion, and $1.5 billion in 2020, 2019, and 2018, respectively. equivalents also include amounts due from third-party financial institutions for credit and debit card transactions. These receivables typically settle in five days or less. 7. Fair Value Measurements Fair value measurements are reported in one of three levels based on the lowest level of significant input used: Level 1 (unadjusted quoted Cash and Cash Equivalents January 30, February 1, prices in active markets); Level 2 (observable market inputs, other than quoted prices included in Level 1); and Level 3 (unobservable inputs (millions) 2021 2020 that cannot be corroborated by observable market data). Cash $ 307 $ 326 Short-term investments 7,644 1,810 Fair Value Measurements - Recurring Basis Fair Value as of Receivables from third-party financial institutions for credit and debit card transactions 560 441 Pricing January 30 February 1, Cash and cash equivalents (a) $ 8,511 $ 2,577 (millions Classification Category 2021 2020 Assets (a) We have access to these funds without any significant restrictions, taxes or penalties. Short-term investments (a) Cash and Cash Equivalents Level 1 $ 7,644 $ 1,810 Prepaid forward contracts () Other Current Assets Level 1 38 23 As of January 30, 2021, and February 1, 2020, we reclassified book overdrafts of $240 million and $209 million, respectively, to Accounts Equity securities (c) Other Current Assets Level 1 39 Payable and $24 million and $23 million, respectively, to Accrued and Other Current Liabilities. Interest rate swaps () Other Noncurrent Assets Level 2 188 137 (a) Carrying value approximates fair value because maturities are less than three months. 9. Inventory Initially valued at transaction price. Subsequently valued by reference to the market price of Target common stock. Represents our investment in Casper common stock. The vast majority of our inventory is accounted for under the retail inventory accounting method (RIM) using the last-in, first-out (LIFO) Valuations are based on observable inputs to the valuation model (e.g., interest rates and credit spreads). See Note 17 for additional method. Inventory is stated at the lower of LIFO cost or market. Inventory cost includes the amount we pay to our suppliers to acquire information on interest rate swaps. inventory, freight costs incurred to deliver product to our distribution centers and stores, and import costs, reduced by vendor income and cash discounts. Distribution center operating costs, including compensation and benefits, are expensed in the period incurred. Inventory is In 2020 and 2019, we recorded pretax losses of $19 million and $41 million, respectively, related to our investment in Casper within Net Other (Income) / Expense. We sold our investment during 2020. also reduced for estimated losses related to shrink and markdowns. The LIFO provision is calculated based on inventory levels, markup rates, and internally measured retail price indices. Under RIM, inventory cost and the resulting gross margins are calculated by applying a cost-to-retail ratio to the inventory retail value. RIM is TARGET CORPORATION 2020 Form 10-K an averaging method that has been widely used in the retail industry due to its practicality. The use of RIM will result in inventory being valued at the lower of cost or market because permanent markdowns are taken as a reduction of the retail value of inventory. 10. Other Current Assets Other Current Assets (millions) January 30, 2021 February 1, 2020 Accounts and other receivables $ 631 $ 498 Vendor income receivable 504 464 Prepaid expenses 171 154 Other 286 217 Total $ 1,592 $ 1,333 TARGET CORPORATION ) 2non Farm 10.K11. Property and Equipment Property and equipment, including assets acquired under finance leases, is depreciated using the straight-line method over estimated useful ives or lease terms if shorter. We amortize leasehold improvements purchased after the beginning of the initial lease term over the shorter of the assets' useful lives or a term that includes the original lease term, plus any renewals that are reasonably certain at the date the leasehold mprovements are acquired. Depreciation expense for 2020, 2019, and 2018 was $2.5 billion, $2.6 billion, and $2.5 billion, respectively, Including depreciation expense included in Cost of Sales. For income tax purposes, accelerated depreciation methods are generally used. 14. Accrued and Other Current Liabilities Repair and maintenance costs are expensed as incurred. Facility pre-opening costs, including supplies and payroll, are expensed as incurred. Accrued and Other Current Liabilities (millions) January 30, 2021 February 1, 2020 Estimated Useful Lives Life (Years) Wages and benefits 1,677 $ 1,158 Real estate, sales, and other taxes payable 1,103 601 Buildings and improvements 8-39 Gift card liability, net of estimated breakage 1,035 935 Fixtures and equipment 2-15 Income tax payable 473 129 Computer hardware and software 2-7 Dividends payable 341 333 Current portion of operating lease liabilities 211 200 Workers' compensation and general liability (@) 169 155 Interest payable 79 We review long-lived assets for impairment when store performance expectations, events, or changes in circumstances-such as a decision 69 Other to relocate or close a store or distribution center, discontinue a project, or make significant software changes-indicate that the asset's 1,034 826 Total 6,122 $ .406 carrying value may not be recoverable. We recognized impairment losses of $62 million, $23 million, and $92 million during 2020, 2019, and 2018, respectively. For asset groups classified as held for sale, measurement of an impairment loss is based on the excess of the carrying We retain a substantial portion of the risk related to general liability and workers' compensation claims. We estimate our ultimate cost amount of the asset group over its fair value. We estimate fair value by obtaining market appraisals, obtaining valuations from third-party based on analysis of historical data and actuarial estimates. General liability and workers' compensation liabilities are recorded at our estimate of their net present value. brokers, or using other valuation techniques. Impairments are recorded in SG&A Expenses. 15. Commitments and Contingencies 12. Other Noncurrent Assets Contingencies Other Noncurrent Assets February 1, January 30, 2021 2020 We are exposed to claims and litigation arising in the ordinary course of business and use various methods to resolve these matters in a (millions) manner that we believe serves the best interest of our shareholders and other constituents. When a loss is probable, we record an accrual Goodwill and intangible assets $ 668 $ 686 based on the reasonably estimable loss or range of loss. When no point of loss is more likely than another, we record the lowest amount in Company-owned life insurance investments, net of loans 450 418 the estimated range of loss and, if material, disclose the estimated range of loss. We do not record liabilities for reasonably possible loss Other 268 254 contingencies, but do disclose a range of reasonably possible losses if they are material and we are able to estimate such a range. If we cannot provide a range of reasonably possible losses, we explain the factors that prevent us from determining such a range. Historically, Total $ 1,386 $ 1,358 adjustments to our estimates have not been material. We believe the recorded reserves in our consolidated financial statements are adequate in light of the probable and estimable liabilities. We do not believe that any of these identified claims or litigation will be material to our results of operations, cash flows, or financial condition. 13. Goodwill and Intangible Assets Commitments Goodwill totaled $631 million and $633 million as of January 30, 2021, and February 1, 2020, respectively. No impairments were recorded in Purchase obligations, which include all legally binding contracts such as merchandise royalties, equipment purchases, marketing-related 2020, 2019, or 2018 as a result of the annual goodwill impairment tests performed. contracts, software acquisition/license commitments, firm minimum commitments for inventory purchases, and service contracts, were $785 million and $676 million as of January 30, 2021, and February 1, 2020, respectively. These purchase obligations are primarily due within Intangible assets, net of accumulated amortization, totaled $37 million and $53 million as of January 30, 2021, and February 1, 2020, three years and recorded as liabilities when goods are received or services rendered. Real estate obligations, which include legally binding espectively, and primarily related to trademarks and customer relationships. We use both accelerated and straight-line methods to amortize minimum lease payments for leases signed but not yet commenced, and commitments for the purchase, construction, or remodeling of real estate and facilities, were $2.1 billion and $1.4 billion as of January 30, 2021, and February 1, 2020, respectively. Over half of these real definite-lived intangible assets over 4 to 15 years. The weighted average life of intangible assets was 8 years as of January 30, 2021. estate obligations are due within five years, a portion of which are recorded as liabilities. Amortization expense was $15 million, $13 million, and $14 million in 2020, 2019, and 2018, respectively, and is estimated to be less than $15 million annually through 2025. We issue inventory purchase orders in the ordinary course of business, which represent authorizations to purchase that are cancelable by their terms. We do not consider purchase orders to be firm inventory commitments. If we choose to cancel a purchase order, we may be obligated to reimburse the vendor for unrecoverable outlays incurred prior to cancellation. TARGET CORPORATION 2020 Form 10-K TARGET CORPORATION 2020 Form 10-KWe also issue letters of credit and surety bonds in the ordinary course of business. Trade letters of credit totaled $2.0 billion and $1.5 billion 17. Derivative Financial Instruments as of January 30, 2021, and February 1, 2020, respectively, a portion of which are reflected in Accounts Payable. Standby letters of credit and surety bonds, primarily related to insurance and regulatory requirements, totaled $472 million and $468 million as of January 30, 2021, Our derivative instruments consist of interest rate swaps used to mitigate interest rate risk. As a result, we have counterparty credit exposure and February 1, 2020, respectively. to large global financial institutions, which we monitor on an ongoing basis. Note 7 provides the fair value and classification of these instruments 16. Commercial Paper and Long-Term Debt Under our swap agreements, we pay a floating rate equal to 1-month LIBOR and receive a weighted average fixed rate of 2.6 percent. The As of January 30, 2021, the carrying value and maturities of our debt portfolio were as follows: agreements have a weighted average remaining maturity of 6.9 years. As of January 30, 2021, and February 1, 2020, interest rate swaps with notional amounts totaling $1.5 billion were designated as fair value hedges, and all were considered to be perfectly effective under the Debt Maturities January 30, 2021 shortcut method during 2020 and 2019. (dollars in millions) Rate (@) Balance Due 2021-2025 3.0 % $ 3,607 As of January 30, 2021, we were party to forward-starting interest rate swaps with notional amounts totaling $250 million to hedge the Due 2026-2030 3.0 3.39 interest rate exposure of anticipated future debt issuances. We designated these derivative financial instruments as cash flow hedges. As of Due 2031-2035 5.6 507 January 30, 2021, a $5 million gain was recorded in Accumulated Other Comprehensive Loss and will be reclassified to Net Interest Expense Due 2036-2040 6.8 936 when the forecasted transaction affects earnings. Due 2041-2045 4.0 1,084 Due 2046-2050 3 .8 1,117 Total notes and debentures 3.7 10,643 Effect of Hedges on Debt January 30, Swap valuation adjustments 183 (millions) 2021 February 1, 2020 Finance lease liabilities 1,854 Long-term debt and other borrowings Less: Amounts due within one year 1,144) Carrying amount of hedged debt $ 1,677 $ 1,630 Long-term debt and other borrowings $ 11,536 Cumulative hedging adjustments, included in carrying amount 183 137 (a) Reflects the dollar weighted average stated interest rate as of year-end. Effect of Hedges on Net Interest Expense Required Principal Payments (millions) 2020 2019 2018 (millions) 2021 2022 2023 2024 2025 Gain (loss) on fair value hedges recognized in Net Interest Expense Total required principal payments 1,056 $ 63 $ - $ 1,000 $ 1,500 Interest rate swap designated as fair value hedges $ 46 $ 130 $ 13 Hedged debt (46) (130) (13) In October 2020, we repurchased $1.77 billion of debt before its maturity at a market value of $2.25 billion. We recognized a loss on early Total $ - $ - $ retirement of $512 million, which was recorded in Net Interest Expense. In March 2020, we issued unsecured fixed rate debt of $1.5 billion at 2.250 percent that matures in April 2025 and $1.0 billion at 2.650 18. Leases percent that matures in September 2030. We lease certain retail stores, warehouses, distribution centers, office space, land, and equipment. Leases with an initial term of 12 months In January 2020, we issued $750 million of 10-year unsecured fixed rate debt at 2.350 percent, and separately, we redeemed $1.0 billion of or less are not recorded on the balance sheet; we recognize lease expense for these leases on a straight-line basis over the lease term. We 3.875 percent unsecured fixed rate debt before its maturity. We recognized a loss on early retirement of approximately $10 million, which was combine lease and nonlease components for new and reassessed leases recorded in Net Interest Expense. In March 2019, we issued $1.0 billion of 10-year unsecured fixed rate debt at 3.375 percent, and in June 2019, we repaid $1.0 billion of 2.3 Most leases include one or more options to renew, with renewal terms that can extend the lease term from one to 50 years or more. The percent unsecured fixed rate debt at maturity. exercise of lease renewal options is at our sole discretion. Certain leases also include options to purchase the leased property. The depreciable life of assets and leasehold improvements are limited by the expected lease term, unless there is a transfer of title or purchase We obtain short-term financing from time to time under our commercial paper program. option reasonably certain of exercise. Commercial Pape Certain of our lease agreements include rental payments based on a percentage of retail sales over contractual levels and others include (dollars in millions) 2020 2019 2018 rental payments adjusted periodically for inflation. Our lease agreements do not contain any material residual value guarantees or material Maximum daily amount outstanding during the year $ $ 744 $ 658 restrictive covenants Average amount outstanding during the year 41 63 Amount outstanding at year-end We rent or sublease certain real estate to third parties. Our lease and sublease portfolio consists mainly of operating leases with CVS Weighted average interest rate - % 2.36% 2.00 % Pharmacy Inc. (CVS) for space within our stores. TARGET CORPORATION 2020 Form 10-K TARGET CORPORATION 2020 Form 10-KFINANCIAL STATEMENTS Table of Contents NOTES Index to Financial Statements FINANCIAL STATEMENTS Table of Contents NOTES Index to Financial Statements Leases January 30, (millions Classification 2021 February 1, 2020 Assets Maturity of Lease Liabilities Operating Finance millions Leases (a) Leases () Total Operating Operating Lease Assets $ 2,227 $ 2,236 2021 289 $ 152 $ 441 Finance Buildings and Improvements, net of Accumulated Depreciation (@) 1,504 1,180 2022 290 159 449 Total leased assets $ 3,731 $ 3,416 2023 283 158 441 Liabilities 2024 269 155 424 Current 2025 256 154 410 Operating Accrued and Other Current Liabilities $ 211 $ 200 After 2025 1,694 1,687 3,381 Finance Current Portion of Long-term Debt and Other Borrowings 88 67 Total lease payments $ 3,081 $ 2,465 $ 5,546 Noncurrent Less: Interest 652 611 Operating Noncurrent Operating Lease Liabilities 2,218 2,275 Present value of lease liabilities 2,429 $ 1.854 Finance Long-term Debt and Other Borrowings 1,766 1,303 "a) Operating lease payments include $847 million related to options to extend lease terms that are reasonably certain of being Total lease liabilities 4,283 $ 3,845 exercised and exclude $231 million of legally binding minimum lease payments for leases signed but not yet commenced. Note: We use our incremental borrowing rate based on the information available at commencement date in determining the present value of Finance lease payments include $160 million related to options to extend lease terms that are reasonably certain of being exercised lease payments. and exclude $1.1 billion of legally binding minimum lease payments for leases signed but not yet commenced. (a) Finance lease assets are recorded net of accumulated amortization of $550 million and $441 million as of January 30, 2021, and February 1, 2020, respectively. Lease Term and Discount Rate January 30, 2021 February 1, 2020 Weighted average remaining lease term (years) Operating lease 12.6 13.2 Lease Cost (millions) Classification 2020 2019 Finance leases 15.8 2018 15.4 Operating lease cost (a) SG&A Expenses $ 332 $ 287 $ 251 Weighted average discount rate Operating leases 3.54 % 3.71 % Finance lease cos Finance leases 3.68 % 4.23 % Amortization of leased assets Depreciation and Amortization () 105 82 65 Interest on lease liabilities Net Interest Expense 62 51 42 Sublease income () Other Revenue (15) (13) (11) Other Information Net lease cost $ 484 $ 407 $ 347 (millions) 2020 2019 2018 Cash paid for amounts included in the measurement of lease liabilities (a) 2020 includes $44 million of short-term leases and variable lease costs. Short-term and variable lease costs were insignificant for Operating cash flows from operating leases 284 254 $ 231 2019 and 2018. Operating cash flows from finance leases 59 49 45 (b) Supply chain-related amounts are included in Cost of Sales. Financing cash flows from finance leases 70 57 80 Sublease income excludes rental income from owned properties of $48 million, $48 million, and $47 million for 2020, 2019, and 2018, respectively, which is included in Other Revenue. TARGET CORPORATION 2020 Form 10-K 50 TARGET CORPORATION 2020 Form 10-KFINANCIAL STATEMENTS Table of Contents NOTES Index to Financial Statements Net Deferred Tax Asset/ (Liability) (millions) January 30, 2021 February 1, 2020 19. Income Taxes Gross deferred tax assets: Accrued and deferred compensation 623 $ 286 Earnings from continuing operations before income taxes were $5.5 billion, $4.2 billion, and $3.7 billion during 2020, 2019, and 2018, Accruals and reserves not currently deductible 192 147 respectively, including $764 million, $653 million, and $565 million earned by our foreign entities subject to tax outside of the U.S. Self-insured benefits 138 124 Deferred occupancy income 141 148 Tax Rate Reconciliation - Continuing Operations 2020 2019 2018 Lease liabilities 1,108 1,000 Federal statutory rate 21.0 % 21.0 % 21.0 % Other 55 58 State income taxes, net of the federal tax benefit 3.3 3.7 3.6 Total gross deferred tax assets 2,257 L, 763 Internationa (1.2) (1.4) (1.3) Gross deferred tax liabilities: Tax Act (@) (1.0) Property and equipment (2,003) (1,767) Excess tax benefit related to share-based payments (1.0) (0.4) (0.3) Leased assets (996) (880) Federal tax credits (0.6) (0.8) (1.1) Inventory 146) (156) Other (0.3) (0.1) (0.6) Other (82) (74) Effective tax rate 21.2 % 22.0 % 20.3 % Total gross deferred tax liabilities 3,227) (2,877) Total net deferred tax liability (970) $ (1,114) (a) Represents the discrete benefit of the final adjustment to remeasure certain of our net deferred tax liabilities at the lower U.S. corporate income tax rate enacted by the Tax Cuts and Jobs Act of 2017 (Tax Act). We file a U.S. federal income tax return and income tax returns in various states and foreign jurisdictions. The U.S. Internal Revenue Service Provision for Income Taxes (IRS) has completed exams on the U.S. federal income tax returns for years 2018 and prior. With few exceptions, we are no longer subject to (millions) 2020 2019 2018 state and local or non-U.S. income tax examinations by tax authorities for years before 2013. Current: Federal $ 1,013 $ 536 $ 257 Reconciliation of Liability for Unrecognized Tax Benefits State 281 116 (millions) 2020 2019 2018 169 International 68 38 51 Balance at beginning of period $ 160 $ 300 $ 325 35 28 58 Total current 1,362 743 Additions based on tax positions related to the current year 424 Additions for tax positions of prior years 32 13 10 Deferred: Reductions for tax positions of prior years (36) (69) 91) Federal (118 150 263 29 Settlements (10) (112) (2) State (64) 57 Balance at end of period $ 181 $ 160 $ 300 International (1 ) 2 Total deferred 184 178 322 Total provision $ 1,178 $ 921 $ 746 If we were to prevail on all unrecognized tax benefits recorded, $99 million of the $181 million reserve would benefit the effective tax rate. In addition, the reversal of accrued penalties and interest would also benefit the effective tax rate. Interest and penalties associated with unrecognized tax benefits are recorded within income tax expense. During the years ended January 30, 2021, February 1, 2020, and February 2, 2019, we recorded an expense / (benefit) from accrued penalties and interest of $(12) million, $(2) million, and $3 million, respectively. As of January 30, 2021, February 1, 2020, and February 2, 2019 total accrued interest and penalties were $12 million, $27 million, and $32 million, respectively. TARGET CORPORATION 2020 Form 10-K It is reasonably possible that the amount of the unrecognized tax benefits with respect to our other unrecognized tax positions will increase or decrease during the next twelve months; however, an estimate of the amount or range of the change cannot be made at this time. TARGET CORPORATION O 2020 Form 10-KRestricted Stock Unit Activity Total Nonvested Units Restricted Grant Date FINANCIAL STATEMENTS Table of Contents Stock (@) Fair Value (b) NOTES Index to Financial Statements February 1, 2020 4,316 $ 72.93 Granted 1,833 110.80 20. Other Noncurrent Liabilities Forfeited (358) 80.65 Vested (1,427) 70.55 Other Noncurrent Liabilities January 30, 2021 4,364 $ 88.99 (millions) January 30, 2021 February 1, 2020 (a Deferred compensation $ 549 $ 493 Represents the number of shares of restricted stock units, in thousands. For performance-based restricted stock units, assumes Deferred occupancy income (a) 509 539 attainment of maximum payout rates as set forth in the performance criteria. Applying actual or expected payout rates, the number of Income and other taxes payable 436 194 outstanding restricted stock units and performance-based restricted stock units as of January 30, 2021 was 4.33 million Workers' compensation and general liability 341 310 (b) Weighted average per unit. Pension benefits 57 107 Othe 47 81 The expense recognized each period is partially dependent upon our estimate of the number of shares that will ultimately be issued. As of Total $ 1,939 $ 1,724 January 30, 2021, there was $179 million of total unrecognized compensation expense related to restricted stock units, which is expected to To be amortized evenly through 2038. be recognized over a weighted average period of 2.5 years. The fair value of restricted stock units vested and converted to shares of Target common stock was $151 million, $89 million, and $119 million in 2020, 2019, and 2018, respectively. 21. Share Repurchase Performance Share Units We periodically repurchase shares of our common stock under a board-authorized repurchase program through a combination of open market transactions, accelerated share repurchase arrangements, and other privately negotiated transactions with financial institutions. We issue performance share units to certain team members that represent shares potentially issuable in the future. Issuance is ba our performance, generally relative to a retail peer group, over a 3-year performance period on certain measures primarily including sales Share Repurchase Activity growth, after-tax return on invested capital, and EPS growth. The fair value of performance share units is calculated based on the stock price (millions, except per share data) 2020 2019 2018 on the date of grant. The weighted average grant date fair value for performance share units was $106.00, $86.81, and $70.94 in 2020, Total number of shares purchased 5.7 16.0 27.2 2019, and 2018, respectively. Average price paid per share 107.58 $ 95.07 $ 75.88 Total investment 609 $ 1,518 $ 2,067 Performance Share Unit Activity Total Nonvested Units Performance Grant Date 22. Share-Based Compensation Share Units (a) Fair Value (b) February 1, 2020 3,575 $ 72.80 We maintain a long-term incentive plan (the Plan) for key team members and non-employee members of our Board of Directors. The Plan Granted 786 106.00 allows us to grant equity-based compensation awards, including stock options, stock appreciation rights, performance share units, restricted Forfeited (746) 77.73 stock units, restricted stock awards, or a combination of awards (collectively, share-based awards). The number of unissued common shares Vested 827 62.50 reserved for future grants under the Plan was 35.3 million as of January 30, 2021 January 30, 2021 2,788 $ 87.93 Compensation expense associated with share-based awards is recognized on a straight-line basis over the required service period and (a Represents the number of performance share units, in thousands. Assumes attainment of maximum payout rates as set forth in the reflects estimated forfeitures. Share-based compensation expense recognized in SG&A Expenses was $210 million, $152 million, and $134 performance criteria. Applying actual or expected payout rates, the number of outstanding performance share units as of January 30, million, and the related income tax benefit was $39 million, $27 million, and $26 million, in 2020, 2019, and 2018, respectively. 2021 was 2.13 million. (b) Weighted average per unit. Restricted Stock Units The expense recognized each period is partially dependent upon our estimate of the number of shares that will ultimately be issued. Future We issue restricted stock units and performance-based restricted stock units generally with 3-year cliff or 4-year graduated vesting from the grant date (collectively restricted stock units) to certain team members. The final number of shares issued under performance-based compensation expense for unvested awards could reach a maximum of $112 million assuming payout of all unvested awards. The restricted stock units is based on our total shareholder return relative to a retail peer group over a 3-year performance period. We also unrecognized expense is expected to be recognized over a weighted average period of 1.7 years. The fair value of performance share units regularly issue restricted stock units to our Board of Directors, which vest quarterly over a 1-year period and are settled in shares of Target vested and converted to shares of Target common stock was $82 million, $50 million, and $43 million in 2020, 2019, and 2018, respectively. common stock upon departure from the Board. The fair value for restricted stock units is calculated based on the stock price on the date of grant, incorporating an analysis of the total shareholder return performance measure where applicable. The weighted average grant date fair Stock Options value for restricted stock units was $110.80, $80.01, and $72.65 in 2020, 2019, and 2018, respectively. In May 2017, we granted price-vested stock options to certain team members. Additionally, through 2013, we granted nonqualified stock options to certain team members. All outstanding stock options are vested and currently exercisable. TARGET CORPORATION 2020 Form 10-K TARGET CORPORATION 2020 Form 10-KFINANCIAL STATEMENTS NOTES Index to Financial Statements FINANCIAL STATEN NOTES Index to Financial Statements 24. Pension Plans Stock Option Activity Stock Options Total Outstanding Exercisable We have a U.S. qualified defined benefit pension plan covering team members who meet eligibility requirements. This plan is closed to new Number of Exercise Intrinsic Number of Exercise Intrinsic participants. Active participants accrue benefits under a final average pay feature or a cash balance feature. We also have unfunded, Options (a Price (b) Value (c) Options (a) Price (b) Value (") nonqualified pension plans for team members with qualified plan compensation restrictions, as well as international plans. Eligibility and the February 1, 2020 2,478 $ 55.72 $ 136 714 $ 56.02 $ 29 level of benefits under all plans vary depending on each team member's full-time or part-time status, date of hire, age, length of service, Granted and/or compensation. Expired/forfeited Exercised/issued (2,011) 55.70 January 30, 2021 467 $ 55.81 $ 59 467 9 55.81 $ 59 Funded Status Nonqualified and International Qualified Plan Plans (a) In thousands (millions) 2020 2019 2020 2019 Weighted average per share Represents stock price appreciation subsequent to the grant date, in millions. Projected benefit obligations $ 4,594 $ 4,492 $ 74 $ 66 Fair value of plan asset 4,588 4,430 11 11 Stock Option Exercises Funded / (underfunded) status $ (6) $ (62) $ 63) $ (55) (millions) 2020 2019 2018 Cash received for exercise price $ 23 $ 73 $ 96 Intrinsic value 161 59 50 Contributions and Estimated Future Benefit Payments Income tax benefit 41 15 12 obligations to plan participants can be met over time through a combination of company contributions to these plans and earnings on As of January 30, 2021, there was no unrecognized compensation expense related to stock options. The weighted average remaining life of plan assets. We are not required to make any contributions to our qualified defined benefit pension plan in 2021. However, depending on exercisable and outstanding options is 2.2 years. investment performance and plan funded status, we may elect to make a contribution. 23. Defined Contribution Plans Estimated Future Benefit Payments Pension Benefits Team members who meet eligibility requirements can participate in a defined contribution 401(k) plan by investing up to 80 percent of their (millions eligible earnings, as limited by statute or regulation. We match 100 percent of each team member's contribution up to 5 percent of eligible 2021 280 earnings. Company match contributions are made to funds designated by the participant, none of which are based on Target common stock. 2022 218 2023 226 In addition, we maintain an unfunded, nonqualified deferred compensation plan for a broad management group whose participation in our 2024 233 401(k) plan is limited by statute or regulation. These team members choose from a menu of crediting rate alternatives that are generally the same as the investment choices in our 401(k) plan, but also includes a fund based on Target common stock. We credit an additional 2 2025 239 percent per year to the accounts of all active participants, excluding executive officers, in part to recognize the risks inherent to their 2026 - 2030 1,279 participation in this plan. We also maintain a frozen, unfunded, nonqualified deferred compensation plan covering approximately 50 participants. Our total liability under these plans was $602 million and $551 million as of January 30, 2021, and February 1, 2020, respectively. Cost of Plans We mitigate our risk of offering the nonqualified plans through investing in company-owned life insurance and prepaid forward contracts that substantially offset our economic exposure to the returns of these plans. These investments are general corporate assets and are marked to Net Pension Benefits Expense market with the related gains and losses recognized in the Consolidated Statements of Operations in the period they occur. (millions) Classification 2020 2019 2018 Service cost benefits earned SG&A Expenses $ 103 $ 93 9 95 Plan Expenses Interest cost on projected benefit obligation Net Other (Income) / Expense 118 149 146 (millions) 2020 2019 2018 Expected return on assets Net Other (Income) / Expense 242) (248) (246) 401(k) plan matching contributions expense 281 $ 237 $ 229 Amortization of losses Net Other (Income) / Expense 127 62 82 Nonqualified deferred compensation plans Amortization of prior service cost Net Other (Income) / Expense (11) (11) (11) Benefits expense $ 86 $ 80 9 18 Settlement charges Net Other (Income) / Expense 1 1 (53) 4 Related investment (income) / expense (58) 6 96 $ 46 $ Nonqualified plans net expense $ 28 $ 27 $ 24 Total $ 70 TARGET CORPORATION 2020 Form 10-K TARGET CORPORATION 2020 Form 10-KPlan Assets Assumptions Change in Plan Assets Nonqualified and International Benefit Obligation Weighted Average Assumptions Qualified Plan Plans 2020 2019 (millions) 2020 2019 2020 2019 Discount rate 2.84 % 3.13 % Fair value of plan assets at beginning of period $ 4,430 $ 3,915 $ 11 $ 10 Average assumed rate of compensation increase 3.00 3.00 Actual return on plan assets 414 729 2 Cash balance plan interest crediting rate 4.64 4.64 Employer contributions 50 4 5 Participant contributions 11 Net Periodic Benefit Expense Weighted Average Assumptions Benefits paid (263) (275) (6) ( 4 ) 2020 2019 2018 Fair value of plan assets at end of period $ 4,588 $ 4,430 $ 11 $ 11 Discount rate 3.13 % 4.28 % 3.93 % Expected long-term rate of return on plan assets 6.10 6.30 6.30 Our asset allocation policy is designed to reduce the long-term cost of funding our pension obligations. The plan invests with both passive Average assumed rate of compensation increase 3.00 3.00 3.00 and active investment managers depending on the investment. The plan also seeks to reduce the risk associated with adverse movements in Cash balance plan interest crediting rate 4.64 4.64 4.64 interest rates by employing an interest rate hedging program, which includes the use of derivative instruments The weighted average assumptions used to measure net periodic benefit expense each year are the rates as of the beginning of the year Asset Category Current Targeted Actual Allocation (i.e., the prior measurement date). Our most recent compound annual rate of return on qualified plan assets was 10.2 percent, 9.0 percent, Allocation 2020 2019 7.6 percent, and 7.0 percent for the 5-year, 10-year, 15-year, and 20-year time periods, respectively. Domestic equity securities (@) 15 % 16% 14% International equity securities 10 10 10 The market-related value of plan assets is used in calculating the expected return on assets. Historical differences between expected and Debt securities 45 44 46 actual returns are deferred and recognized in the market-related value over a 5-year period from the year in which they occur. Diversified funds 25 25 25 Other (b) 5 5 5 We review the expected long-term rate of return annually and revise it as appropriate. Additionally, we monitor the mix of investments in our portfolio to ensure alignment with our long-term strategy to manage pension cost and reduce volatility in our assets. Our 2020 expected Total 100 % 100 % 100 % annualized long-term rate of return assumptions were 7.0 percent for domestic equity securities, 7.5 percent for international equity (a) Equity securities include our common stock in amounts substantially less than 1 percent of total plan assets in both periods securities, 3.5 percent for long-duration debt securities, 7.0 percent for diversified funds, and 7.5 percent for other investments. These presented. estimates are a judgmental matter in which we consider the composition of our asset portfolio, our historical long-term investment b Other assets include private equity, mezzanine and high-yield debt, natural resources and timberland funds, derivative instruments, performance, and current market conditions. and real estate. Benefit Obligation TARGET CORPORATION 2020 Form 10-K Change in Projected Benefit Obligation Nonqualified and International Qualified Plan Plans (millions) 2020 2019 2020 2019 Benefit obligation at beginning of period $ ,492 $ 3,905 $ 66 $ 53 Service cost 97 90 3 Interest cost 117 146 3 Actuarial loss (@) 144 615 11 Participant contributions 11 Benefits paid (263) (275) ( 6 ) (4) Benefit obligation at end of period (b) $ 4,594 $ 4,492 $ 74 $ 66 (a 2020 and 2019 actuarial losses relate to the decreases in the weighted average discount rate. (b) Accumulated benefit obligation-the present value of benefits earned to date assuming no future salary growth-is materially consistent with the projected benefit obligation in each period presented. TARGET CORPORATION 2020 Form 10-K 57FINANCIAL STATEMENTS Table of Contents NOTES Index to Financial Statements FINANCIAL STATEMENTS & SUPPLEMENTAL INFORMATION Table of Contents NOTES Index to Financial Statements Fair Value Measurements Fair Value at 25. Accumulated Other Comprehensive Loss Pricing January 31 January 31, (millions) Category 2021 2020 Change in Accumulated Other Comprehensive Loss Currency Cash and cash equivalents Level 1 $ 19 12 Cash Flow Translation Hedges Pension Total Derivatives Level 2 (5) 18 (millions) Adjustment Government securities (a) 516 February 1, 2020 (12) $ (19) $ Level 2 $ (837) $ (868) 604 1 19 Fixed income (b) Other comprehensive income before reclassifications, net of tax 15 Level 2 1,42 3 L,330 Amounts reclassified from AOCI, net of tax 6 (a) 87 (b) 93 1,954 1,964 January 30, 2021 (3) (18) (735) (756 Investments valued using NAV per share () Fixed income 68 64 (a) Represents amortization of gains and losses on cash flow hedges, net of taxes, which is recorded in Net Interest Expense. ( b ) Private equity funds 73 75 Represents amortization of pension gains and losses, net of $30 million of taxes, which is recorded in Net Other (Income)/Expense. See Note 24 for additional information. Cash and cash equivalents 115 163 Common collective trusts 1,122 961 Item 9. Changes in and Disagreements with Accountants on Accounting and Financial Disclosure Diversified funds 1,165 1,109 Other 102 105 Not applicable. Total plan assets $ 4,599 4,441 [a) Item 9A. Controls and Procedures Investments in government securities and long-term government bonds. b ) Investments in corporate and municipal bonds. Changes in Internal Control Over Financial Reporting In accordance with Subtopic 820-10, certain investments that are measured at fair value using the net asset value per share (or its equivalent) practical expedient have not been classified in the fair value hierarchy. The fair value amounts presented in this table are During the most recently completed fiscal quarter, the following changes materially affected, or are reasonably likely to materially affect, our intended to permit reconciliation of the fair value hierarchy to the amounts presented in the statement of financial position. internal control over financial reporting: Position Valuation Technique We are in the process of a broad multi-year migration of many mainframe-based systems and middleware products to a modern Cash and cash equivalents Carrying value approximates fair value. platform, including systems and processes supporting inventory and supply chain-related transactions. Derivatives Swap derivatives - Valuations are based on observable inputs to the valuation model (e.g., interest During 2020, as a result of COVID-19, we performed physical inventory counts using a statistical sampling method. Under this rates and credit spreads). Model inputs are changed only when corroborated by market data. A method, we have recorded estimated losses related to shrink and markdowns based upon the results of our sample counts. credit risk adjustment is made on each swap using observable market credit spreads. During the most recently completed fiscal quarter, no other change in our internal control over financial reporting materially affected, or is Option derivatives - Valued at transaction price initially. Subsequent valuations are based on reasonably likely to materially affect, our internal control over financial reporting observable inputs to the valuation model (e.g., underlying investments). Government securities Valued using matrix pricing models and quoted prices of securities with similar characteristics. Evaluation of Disclosure Controls and Procedures and fixed income As of the end of the period covered by this Annual Report, we conducted an evaluation, under supervision and with the participation of Amounts Included in Shareholders' Investment management, including the chief executive officer and chief financial officer, of the effectiveness of the design and operation of our disclosure controls and procedures pursuant to Rules 13a-15 and 15d-15 of the Securities Exchange Act of 1934, as amended (Exchange Act). Based upon that evaluation, our chief executive officer and chief financial officer concluded that our disclosure controls and procedures are effective Amounts in Accumulated Other Comprehensive Loss at a reasonable assurance level. Disclosure controls and procedures are defined by Rules 13a-15(e) and 15d-15(e) of the Exchange Act as (millions) 2020 2019 controls and other procedures that are designed to ensure that information required to be disclosed by us in reports filed with the SEC under Net actuarial loss $ 987 $ 1,138 the Exchange Act is recorded, processed, summarized and reported within the time periods specified in the SEC's rules and forms. (13) Disclosure controls and procedures include, without limitation, controls and procedures designed to ensure that information required to be Prior service credits (2 ) disclosed by us in reports filed under the Exchange Act is accumulated and communicated to our management, including our principal Amounts in Accumulated Other Comprehensive Loss (@) $ 985 $ 1,125 executive and principal financial officers, or persons performing similar functions, as appropriate, to allow timely decisions regarding required "a) disclosure. $735 million and $837 million, net of tax, at the end of 2020 and 2019, respectively. For the Report of Management on Internal Control and the Report of Independent Registered Public Accounting Firm on Internal Control over Financial Reporting, see Part II, Item 8, Financial Statements and Supplementary Data. TARGET CORPORATION 2020 Form 10-K TARGET CORPORATION 2020 Form 10-K