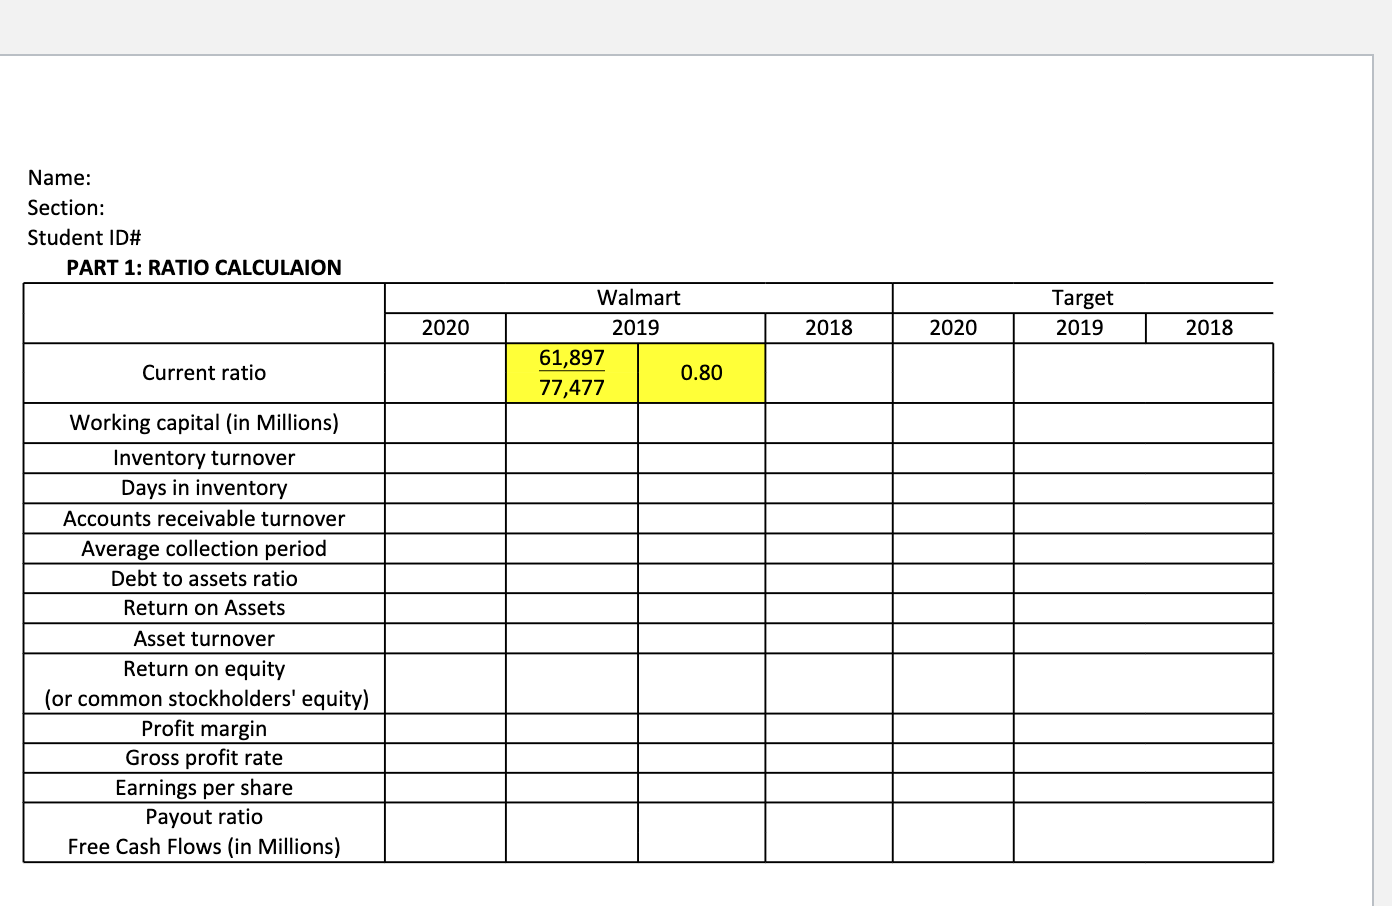


- Using the excel template, Calculate various ratios to evaluate Walmart's financial position, operational efficiency, profitability, and its competitor, Target, for the fiscal years, ending 2018, 2019, and 2020. Find the relevant chapters to see how to calculate each ratio.
- Show your work for each ratio calculation to get credit. See the example in the template.
- Round up your calculation to two decimal points except for working capital and free cash flows. Round to the nearest millions for working capital and free cash flows.
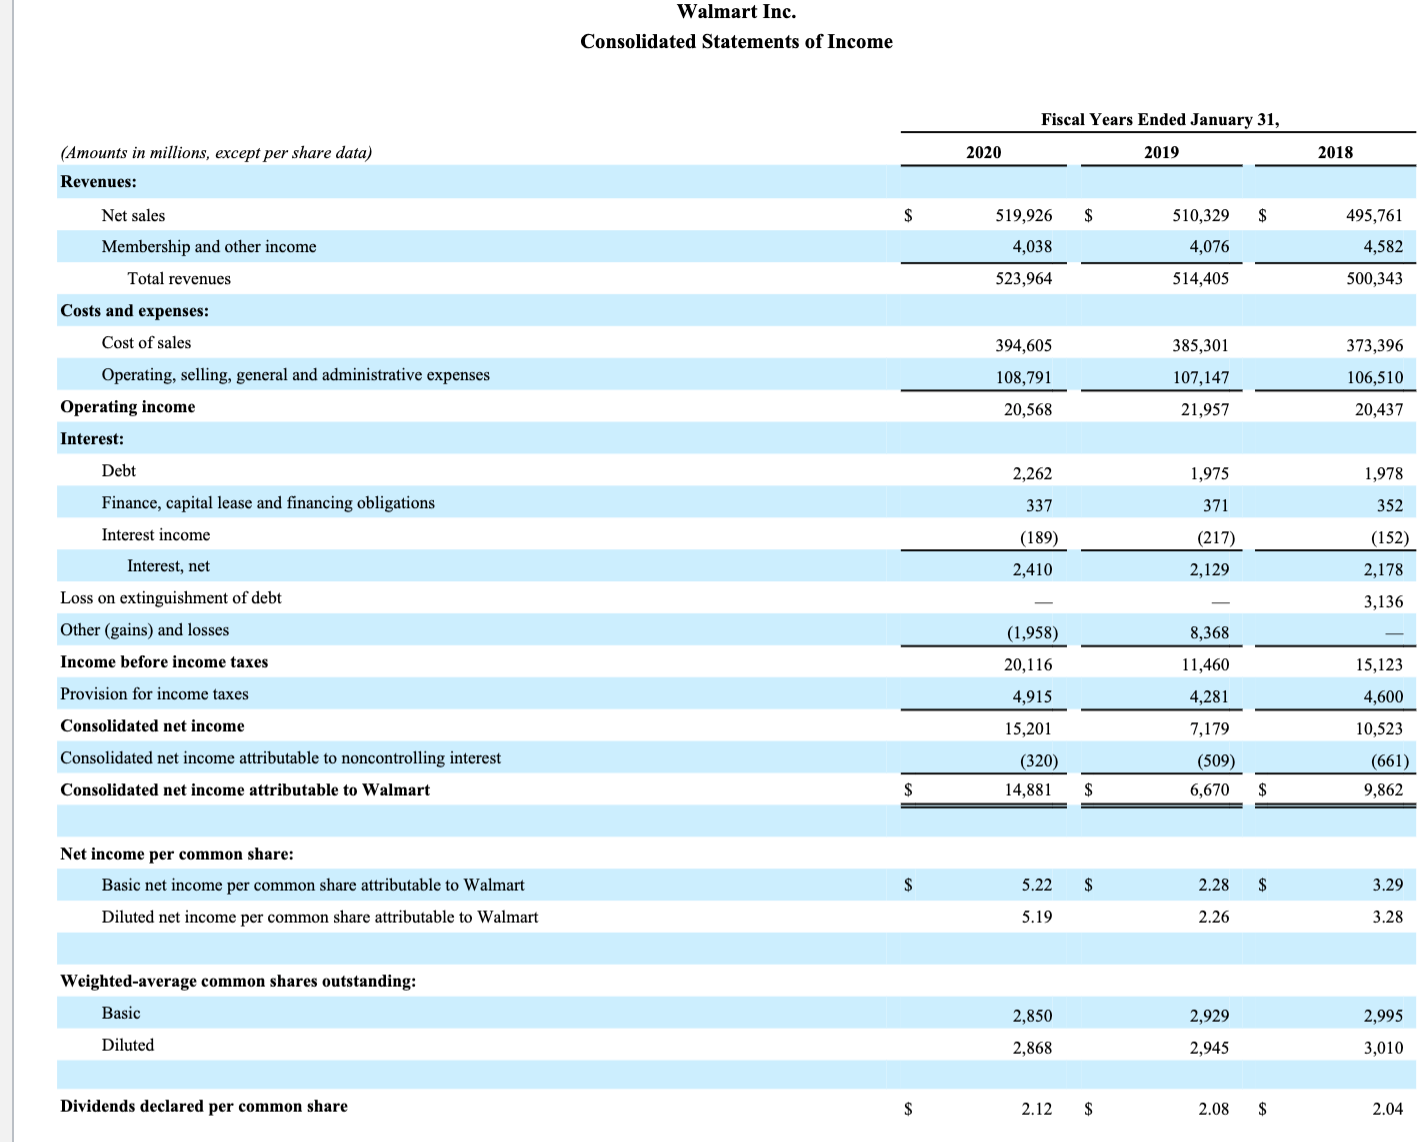
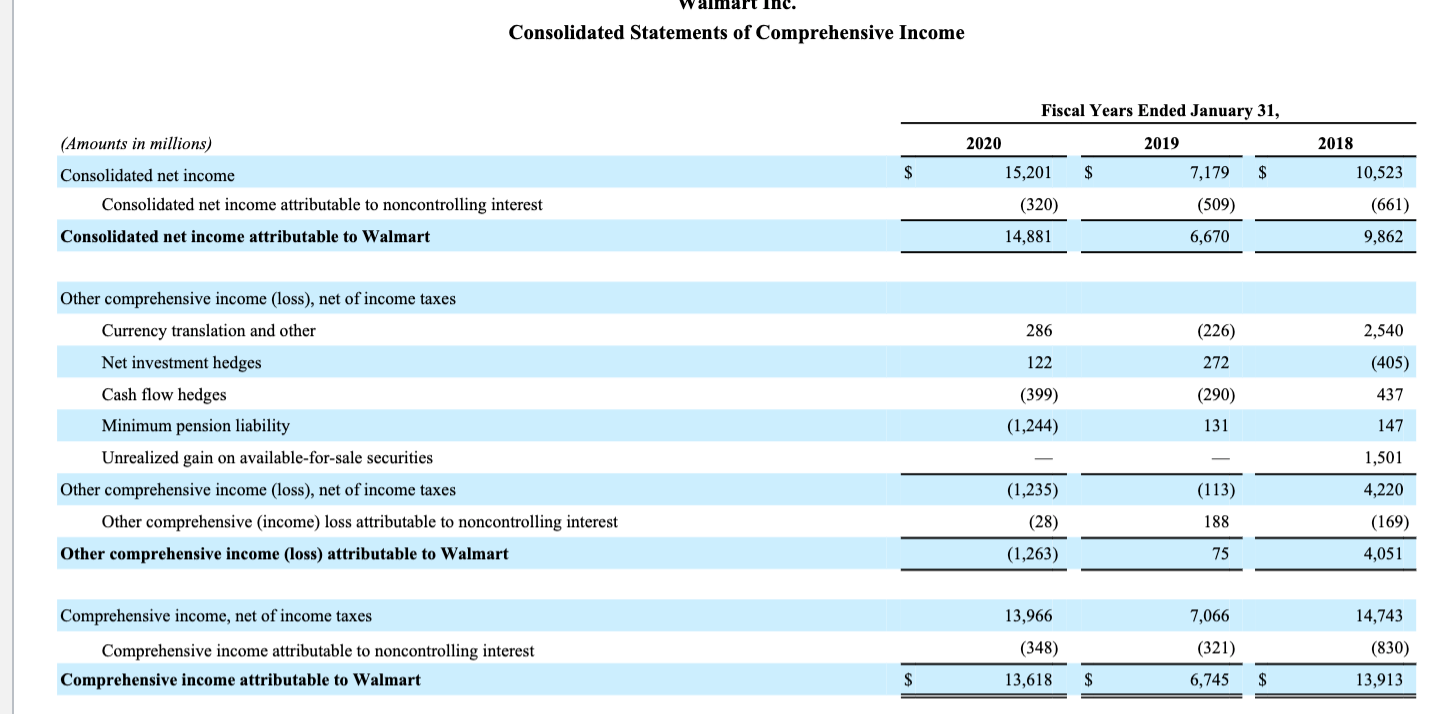
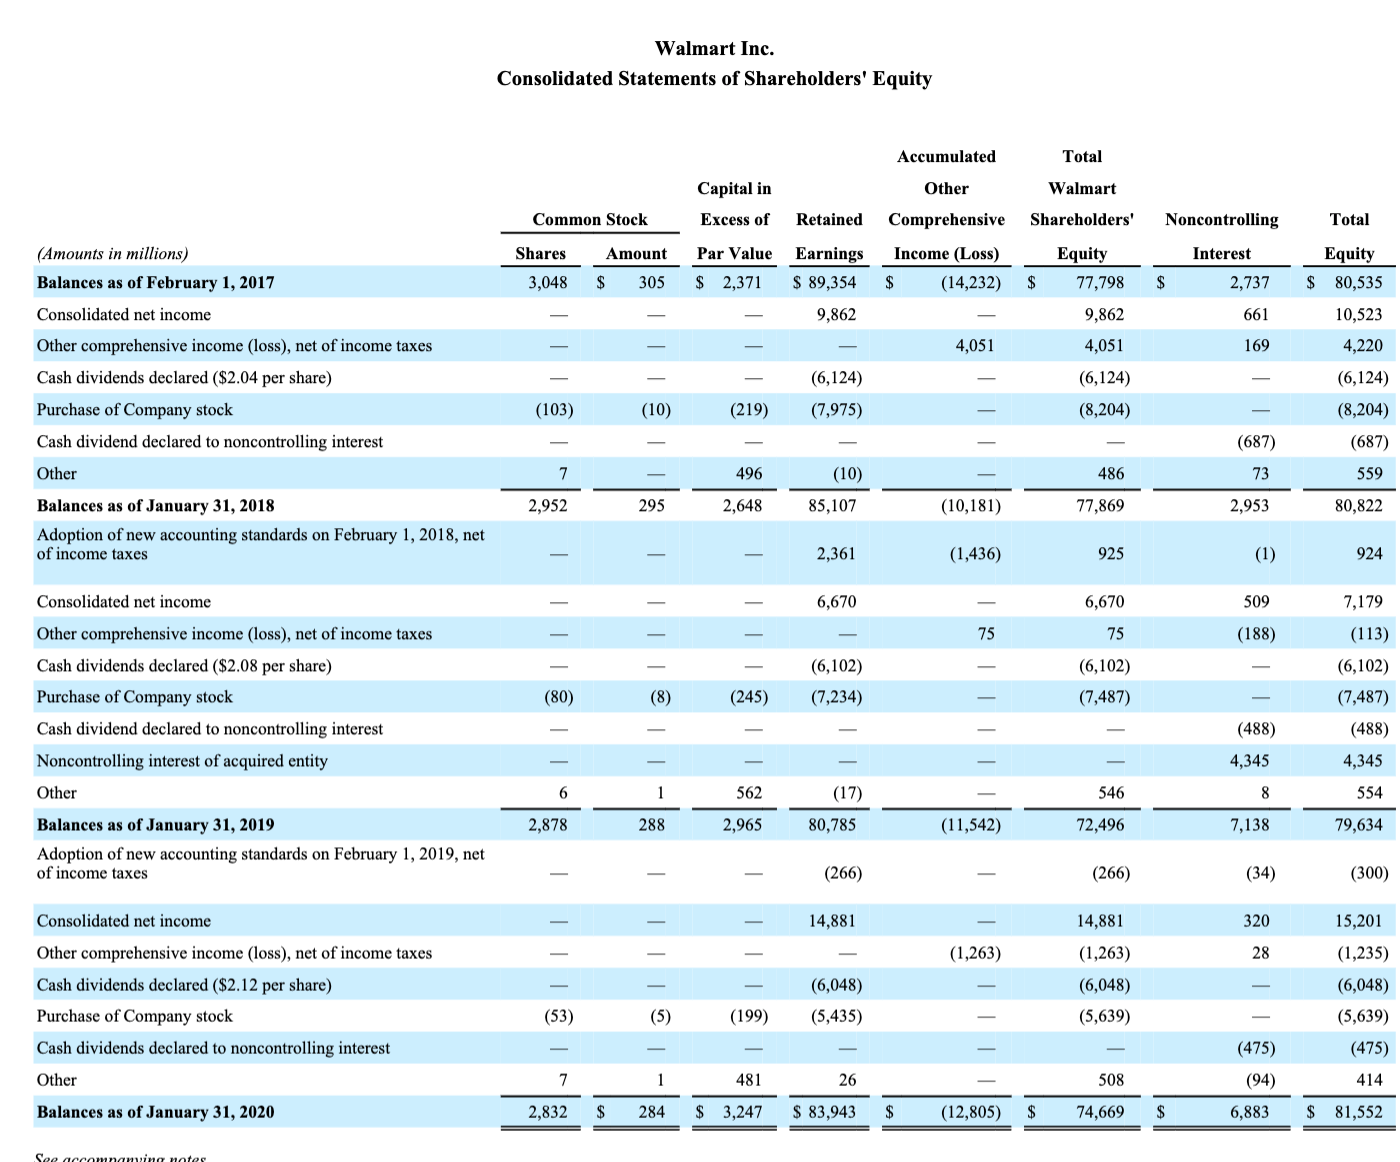
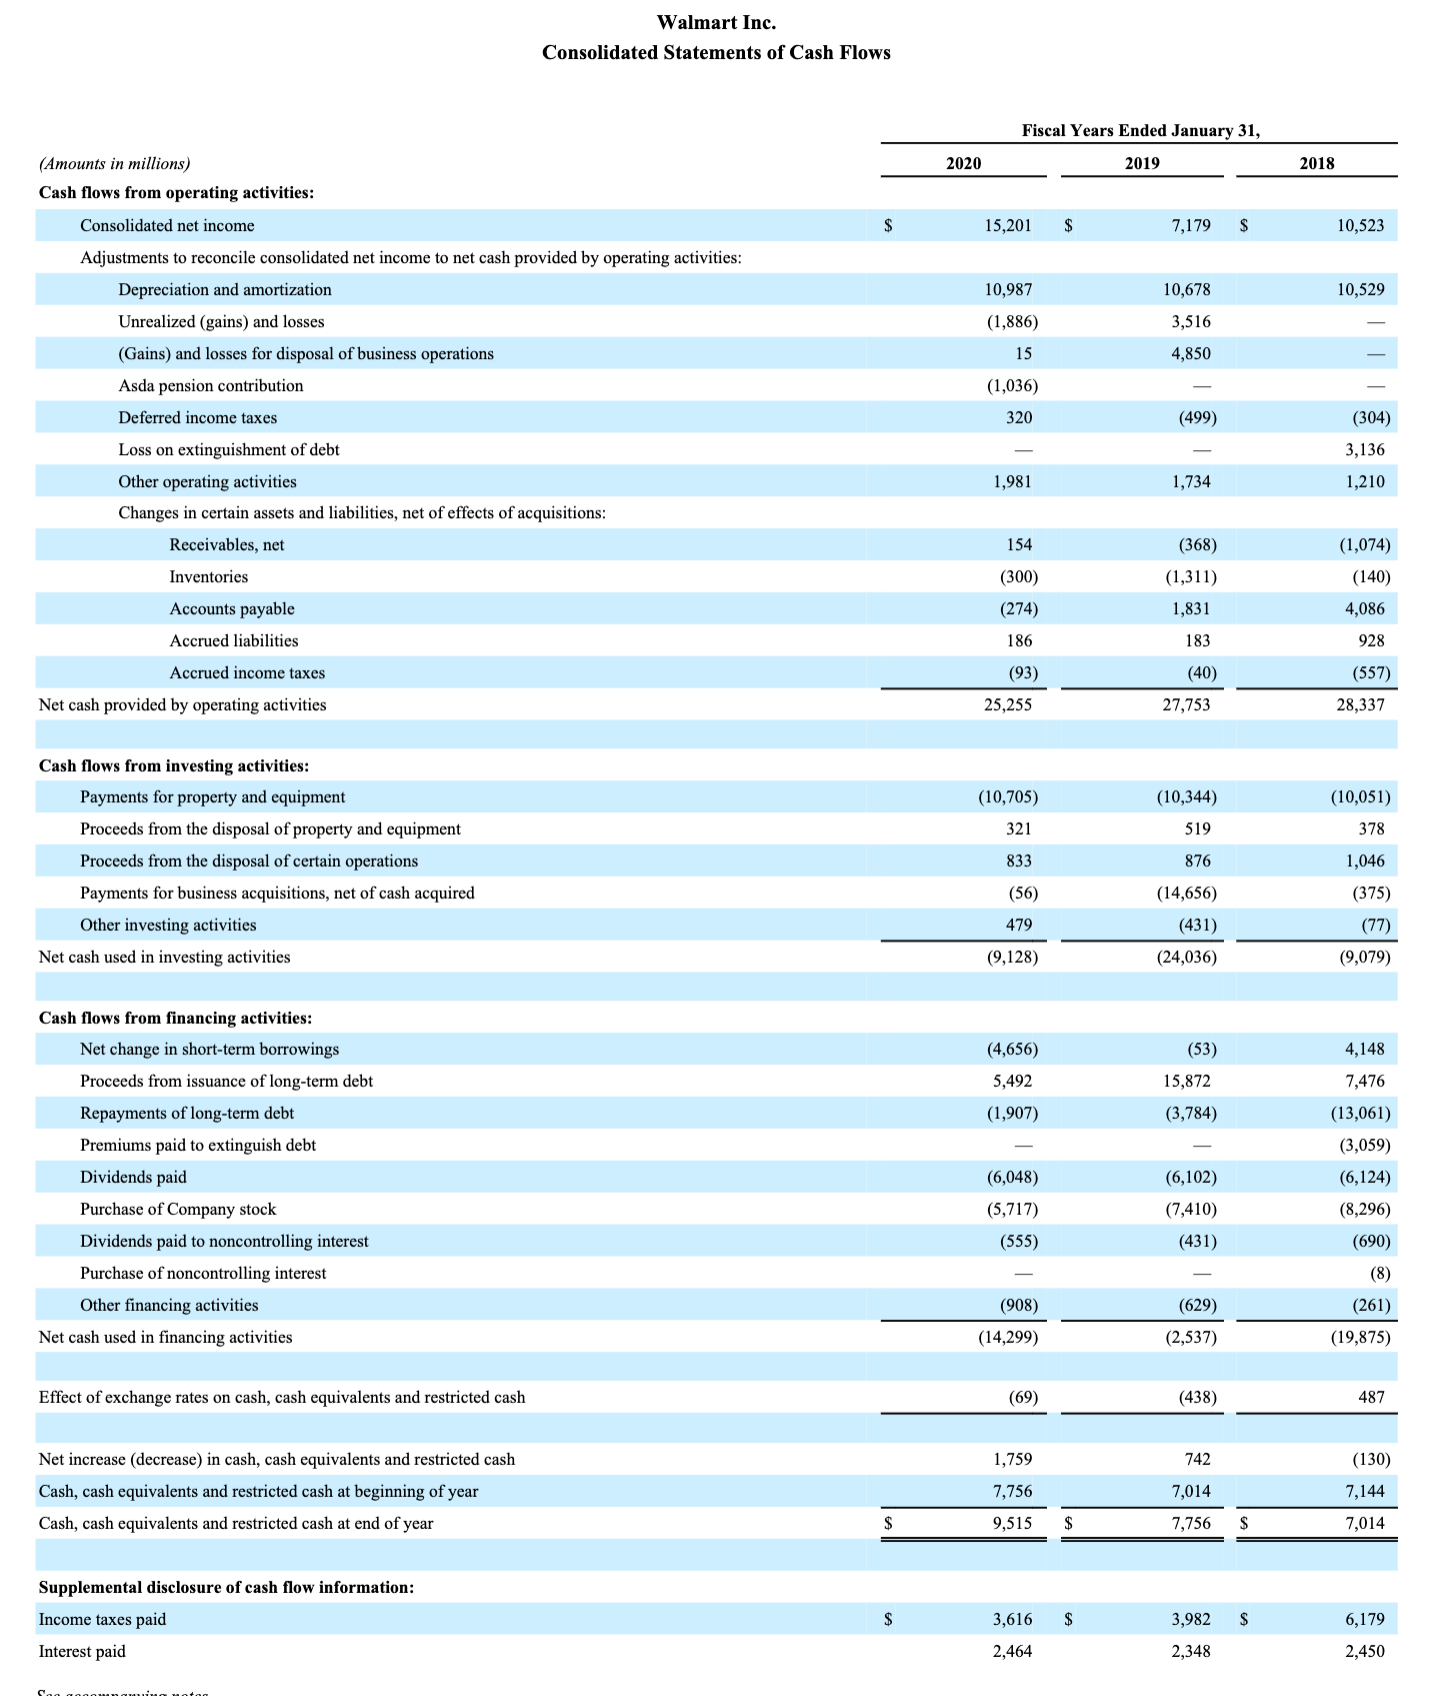
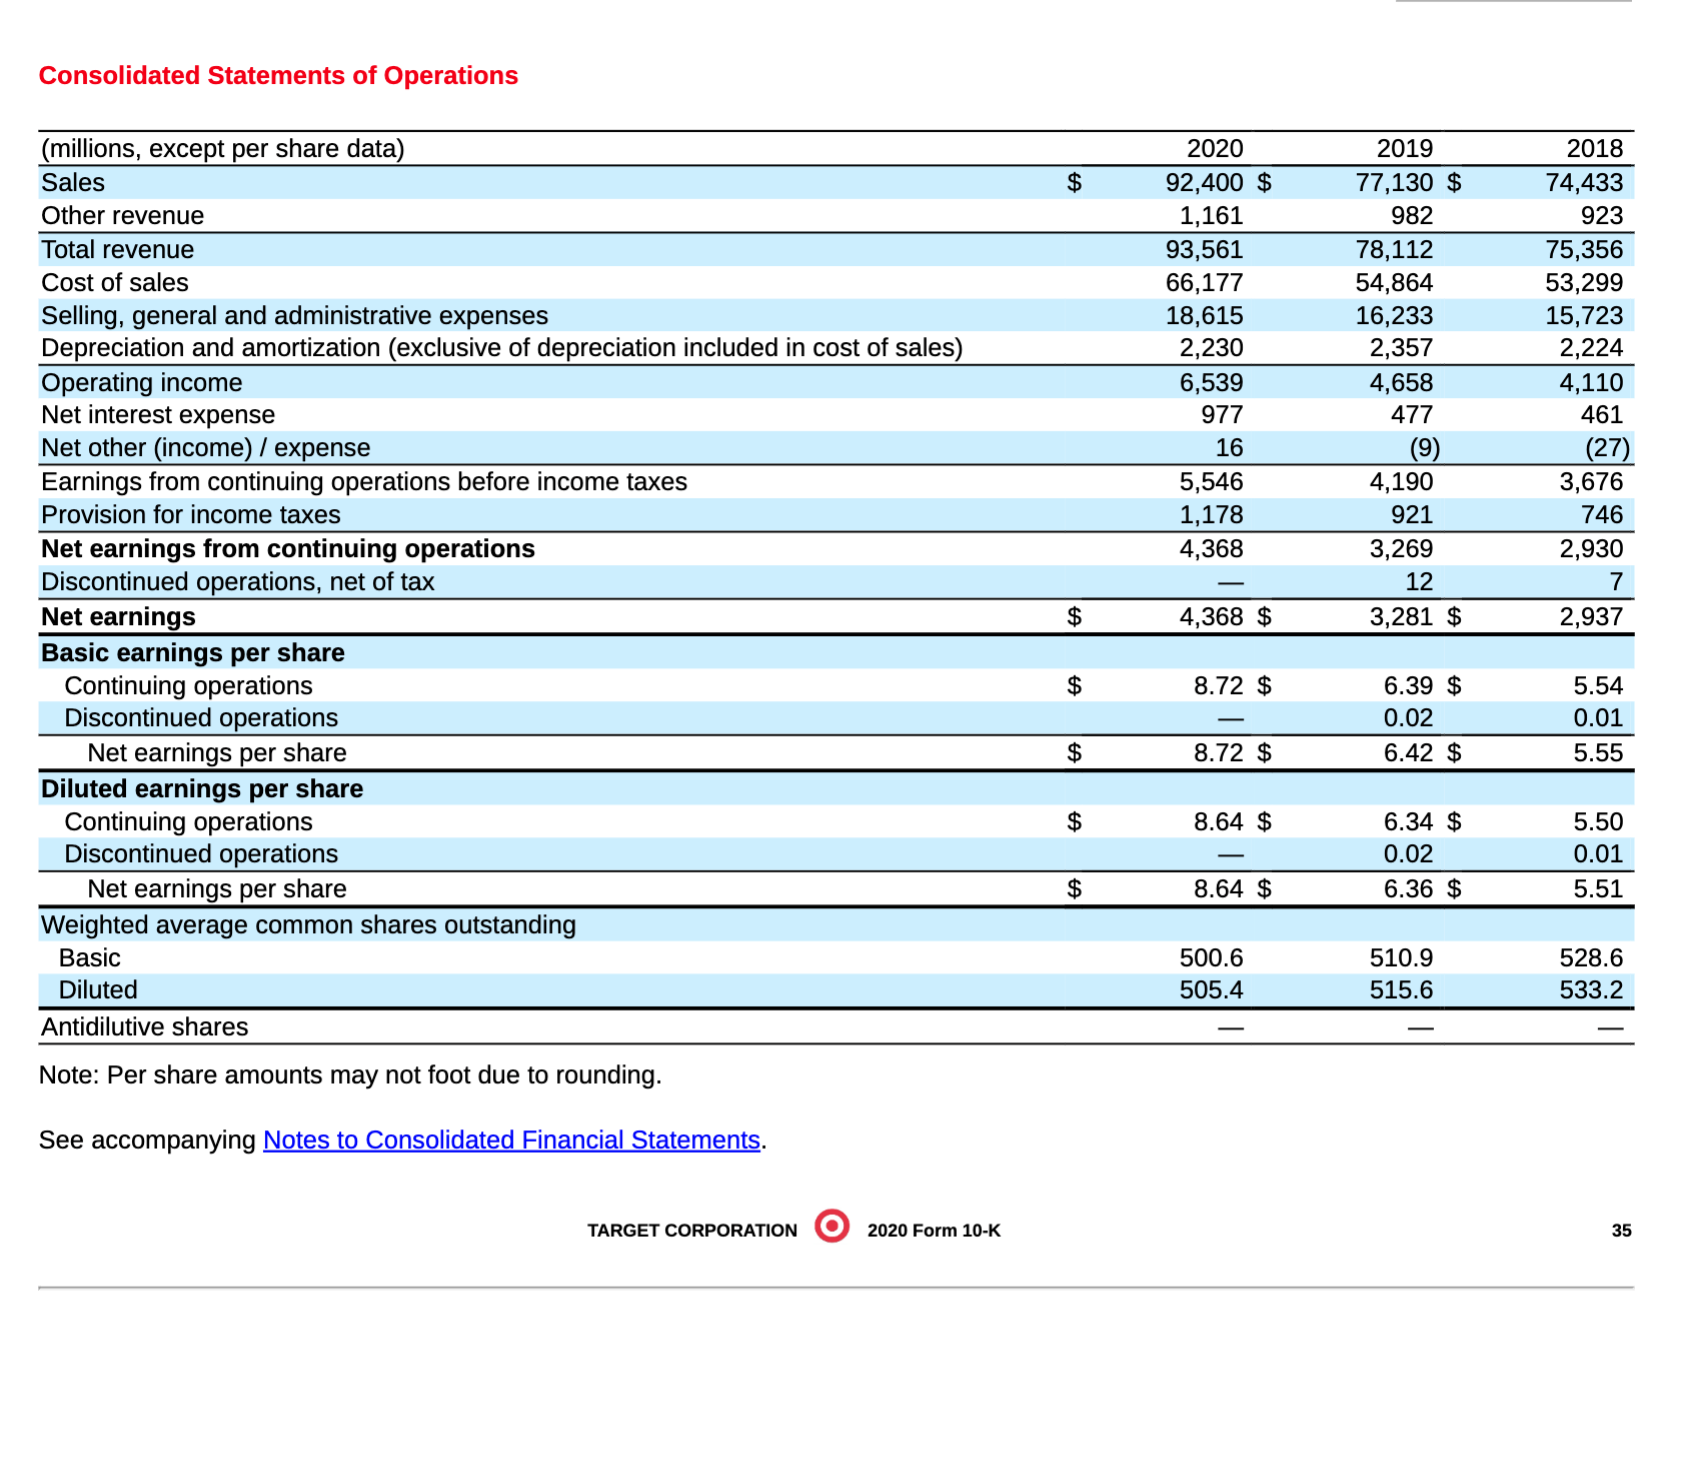
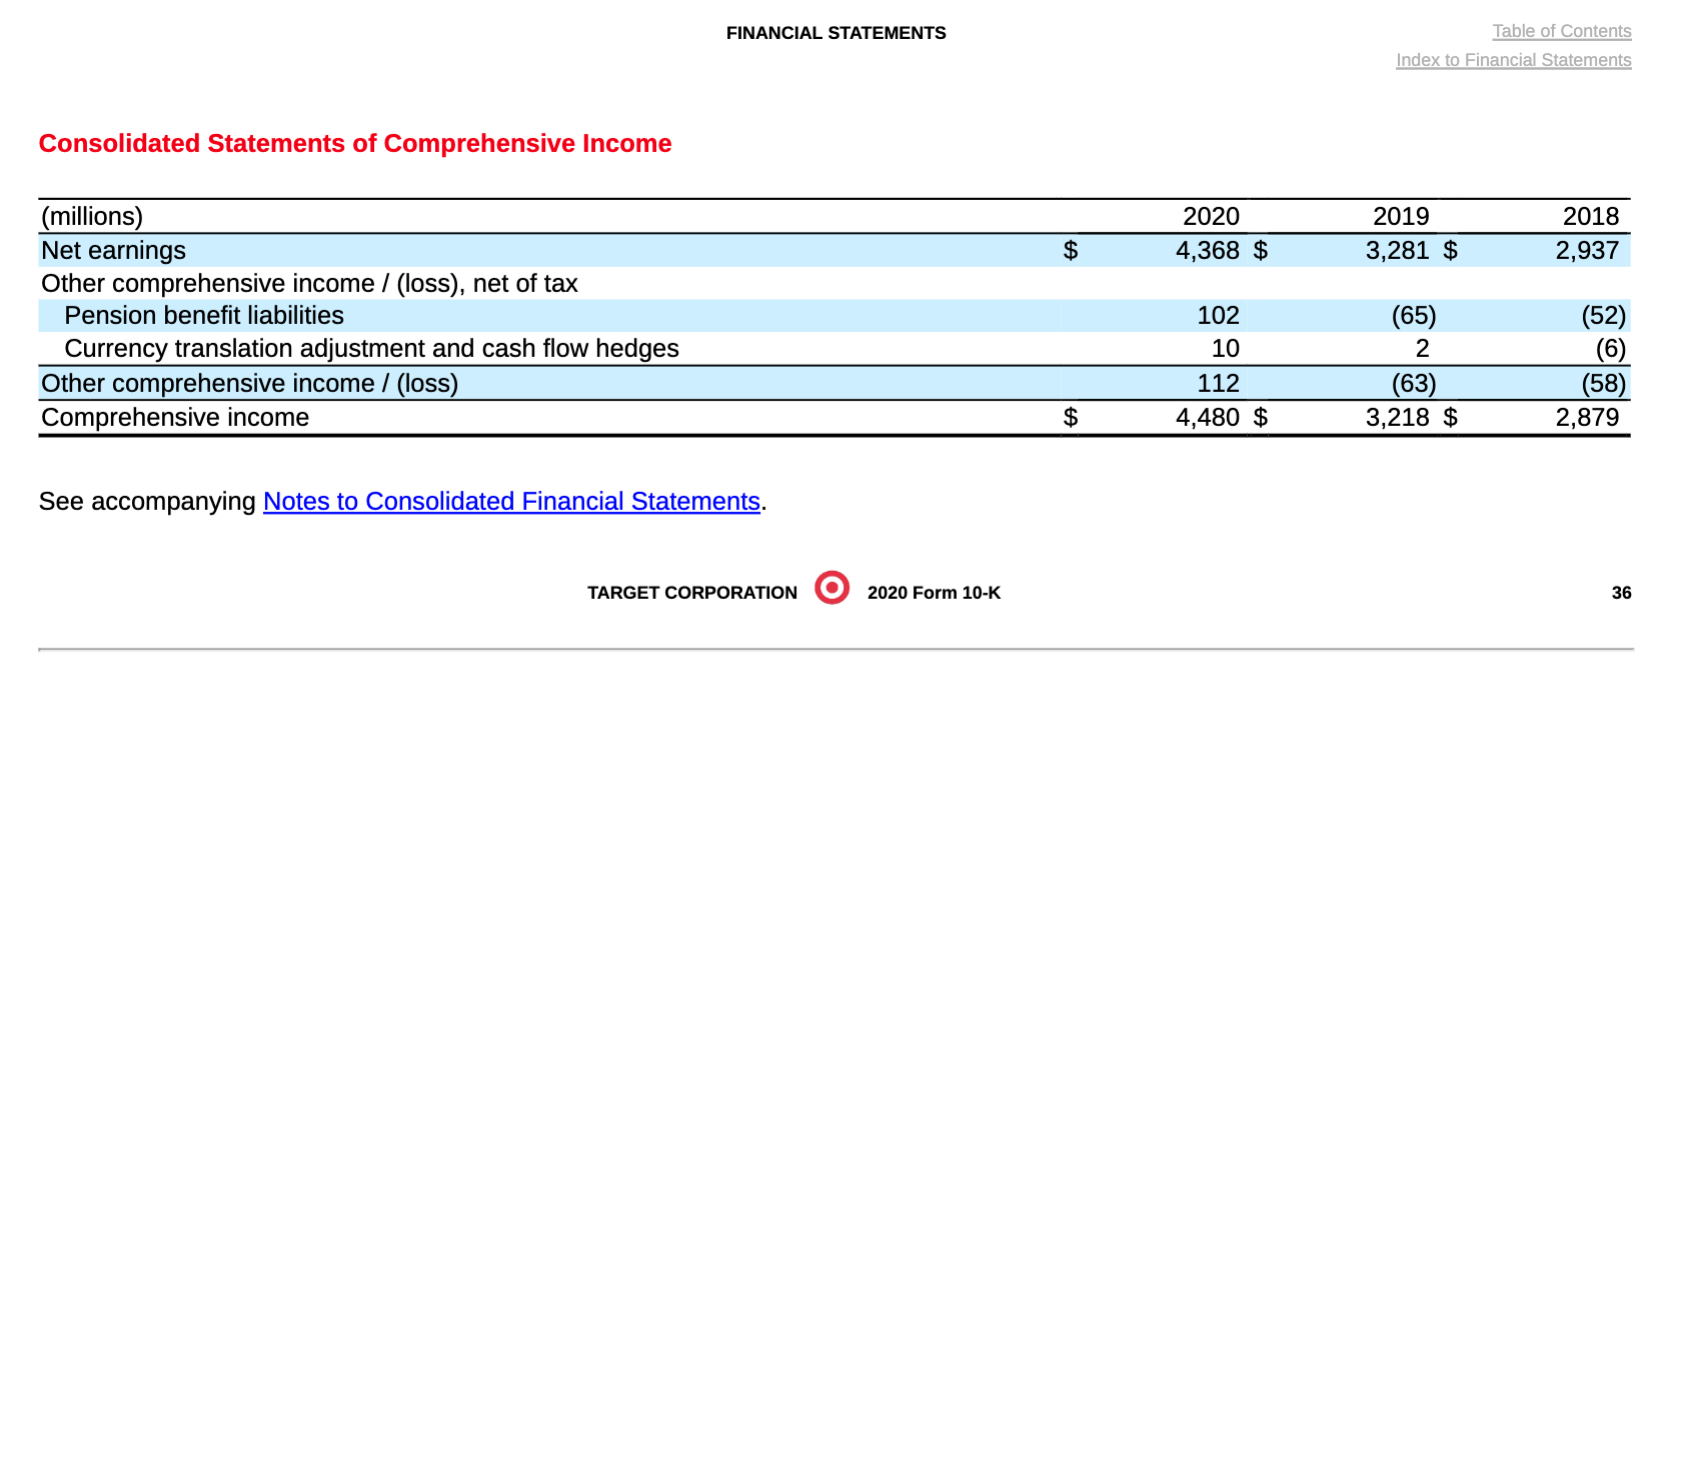
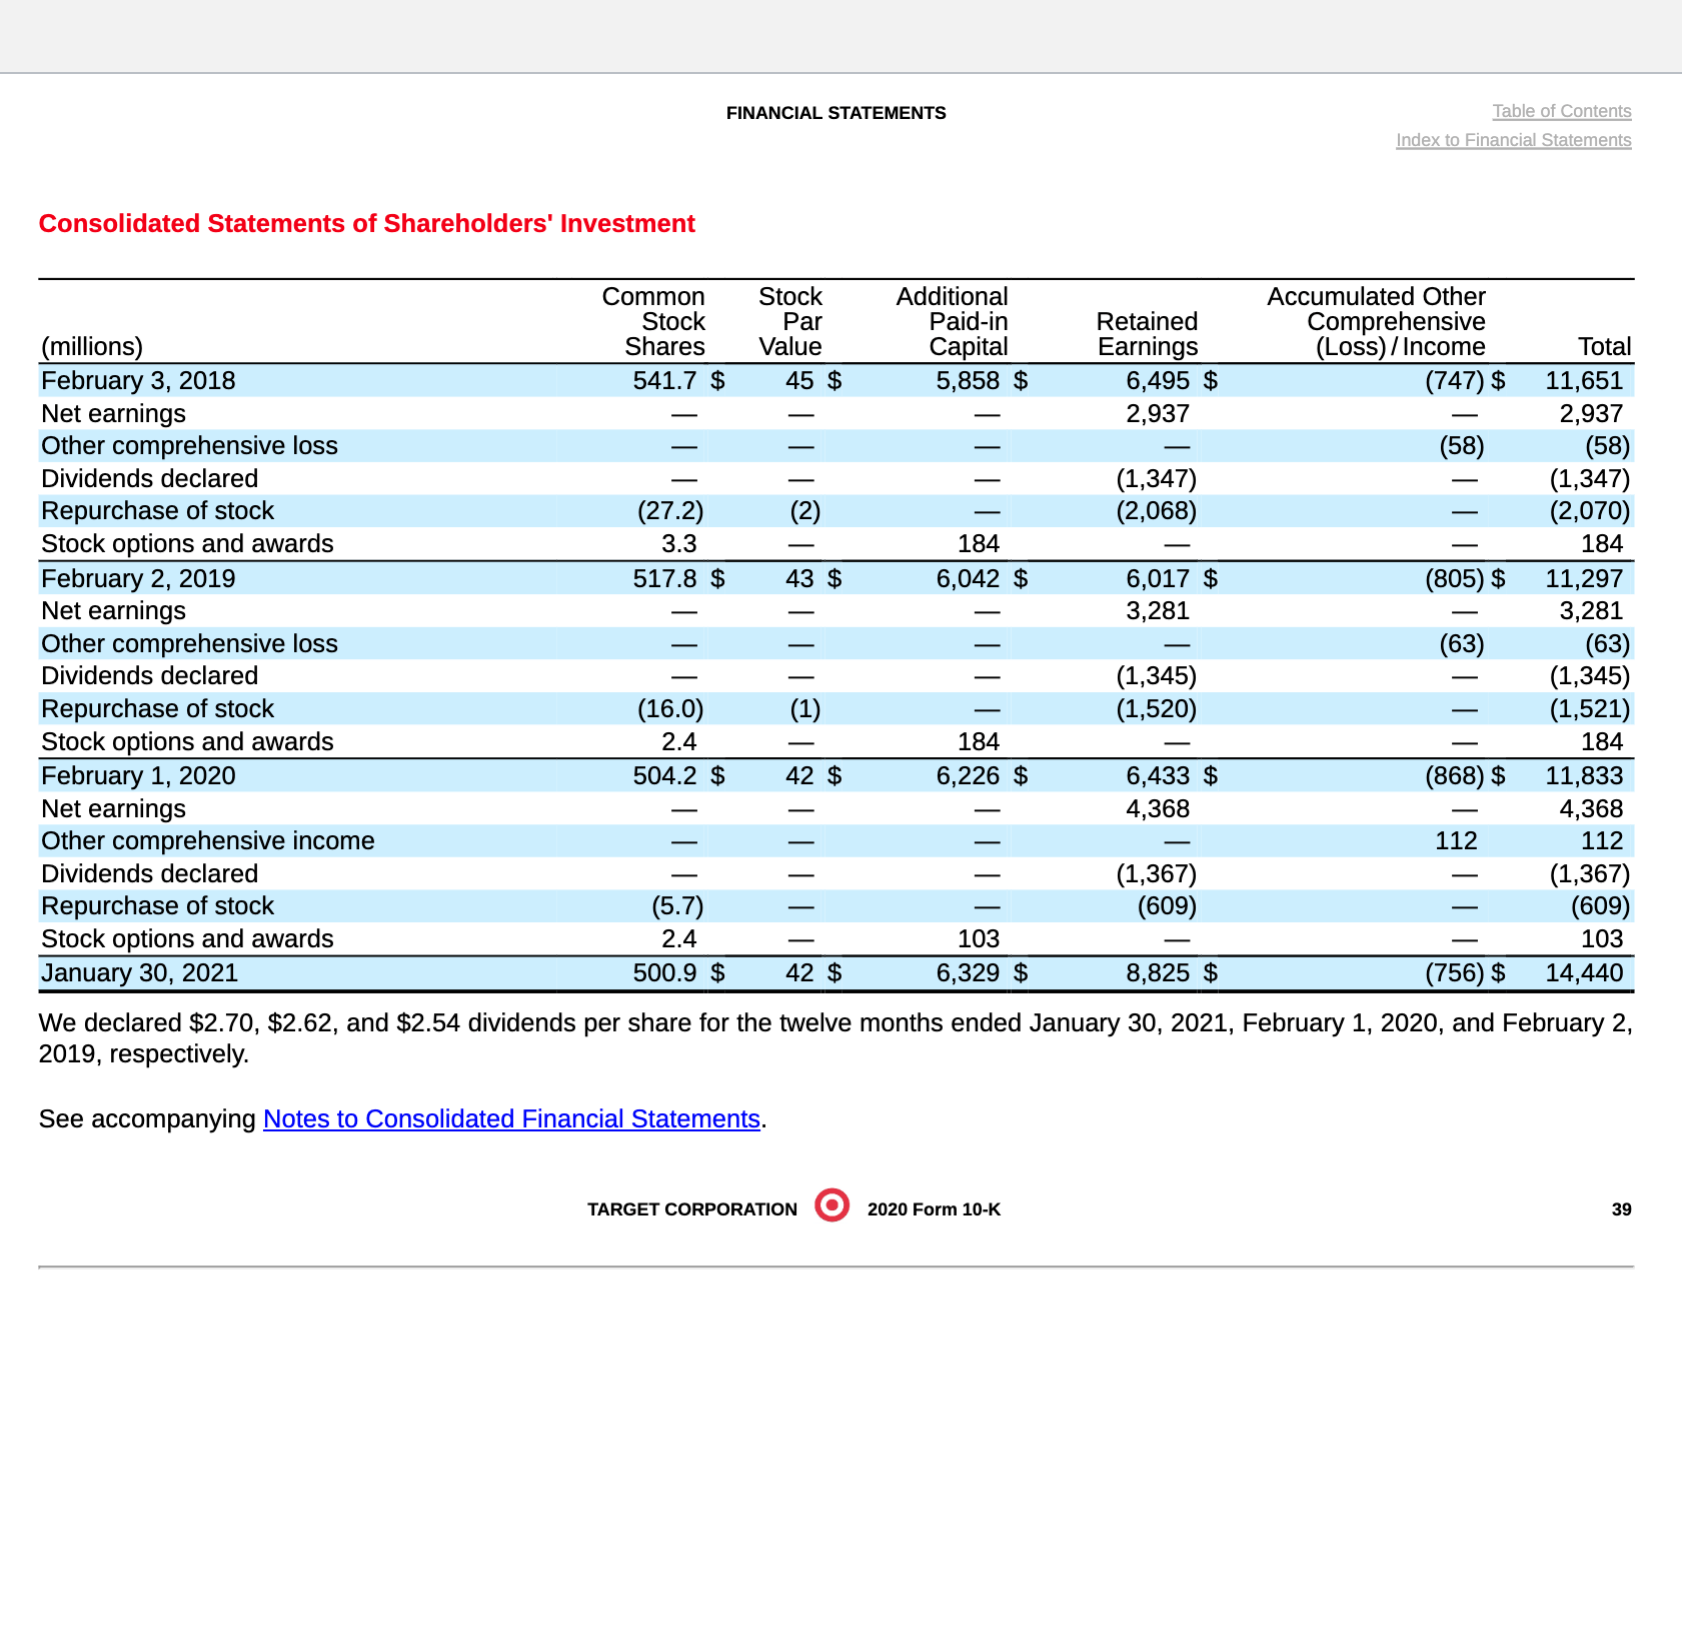
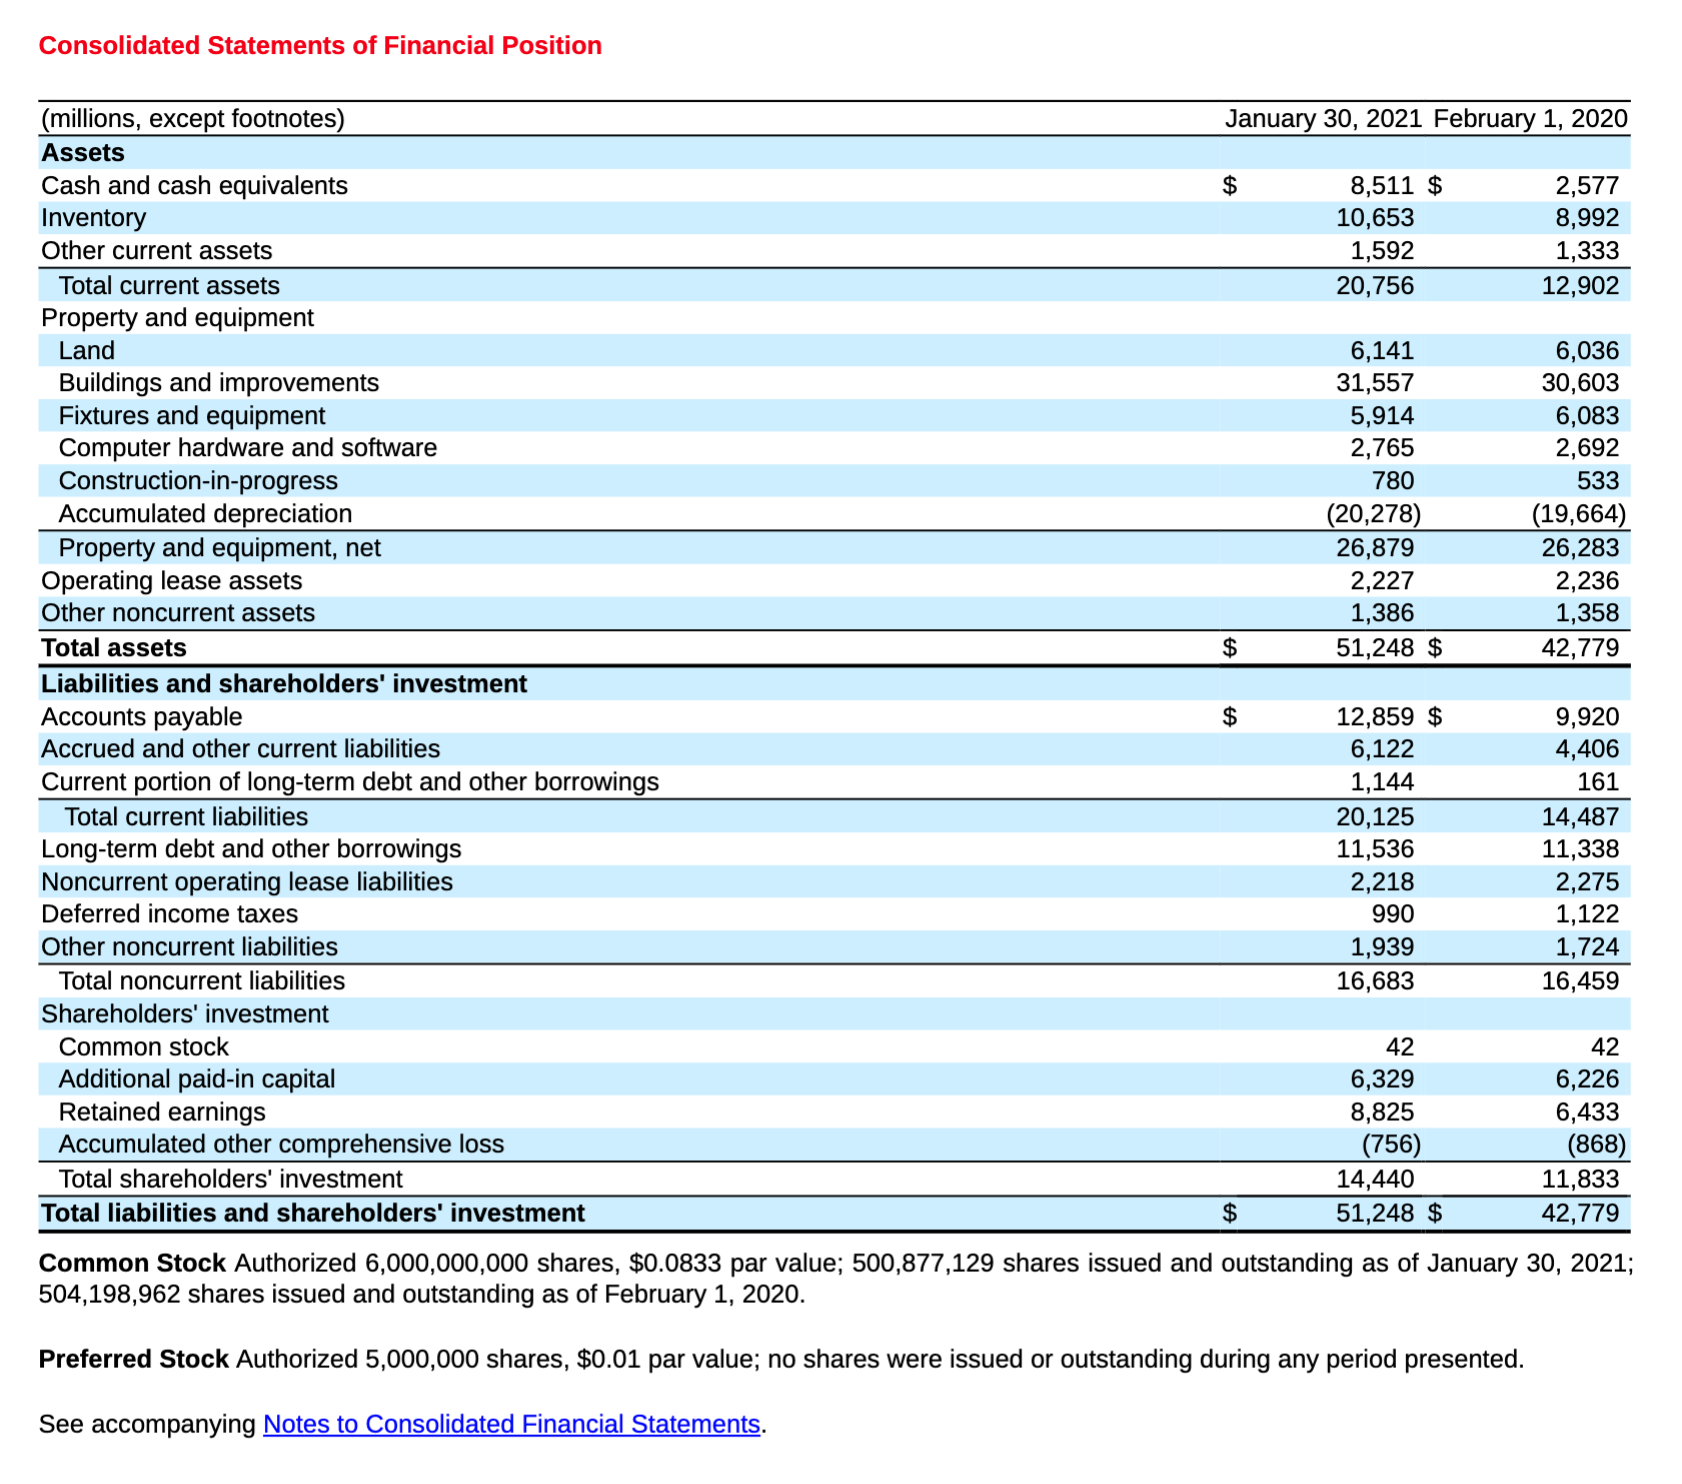
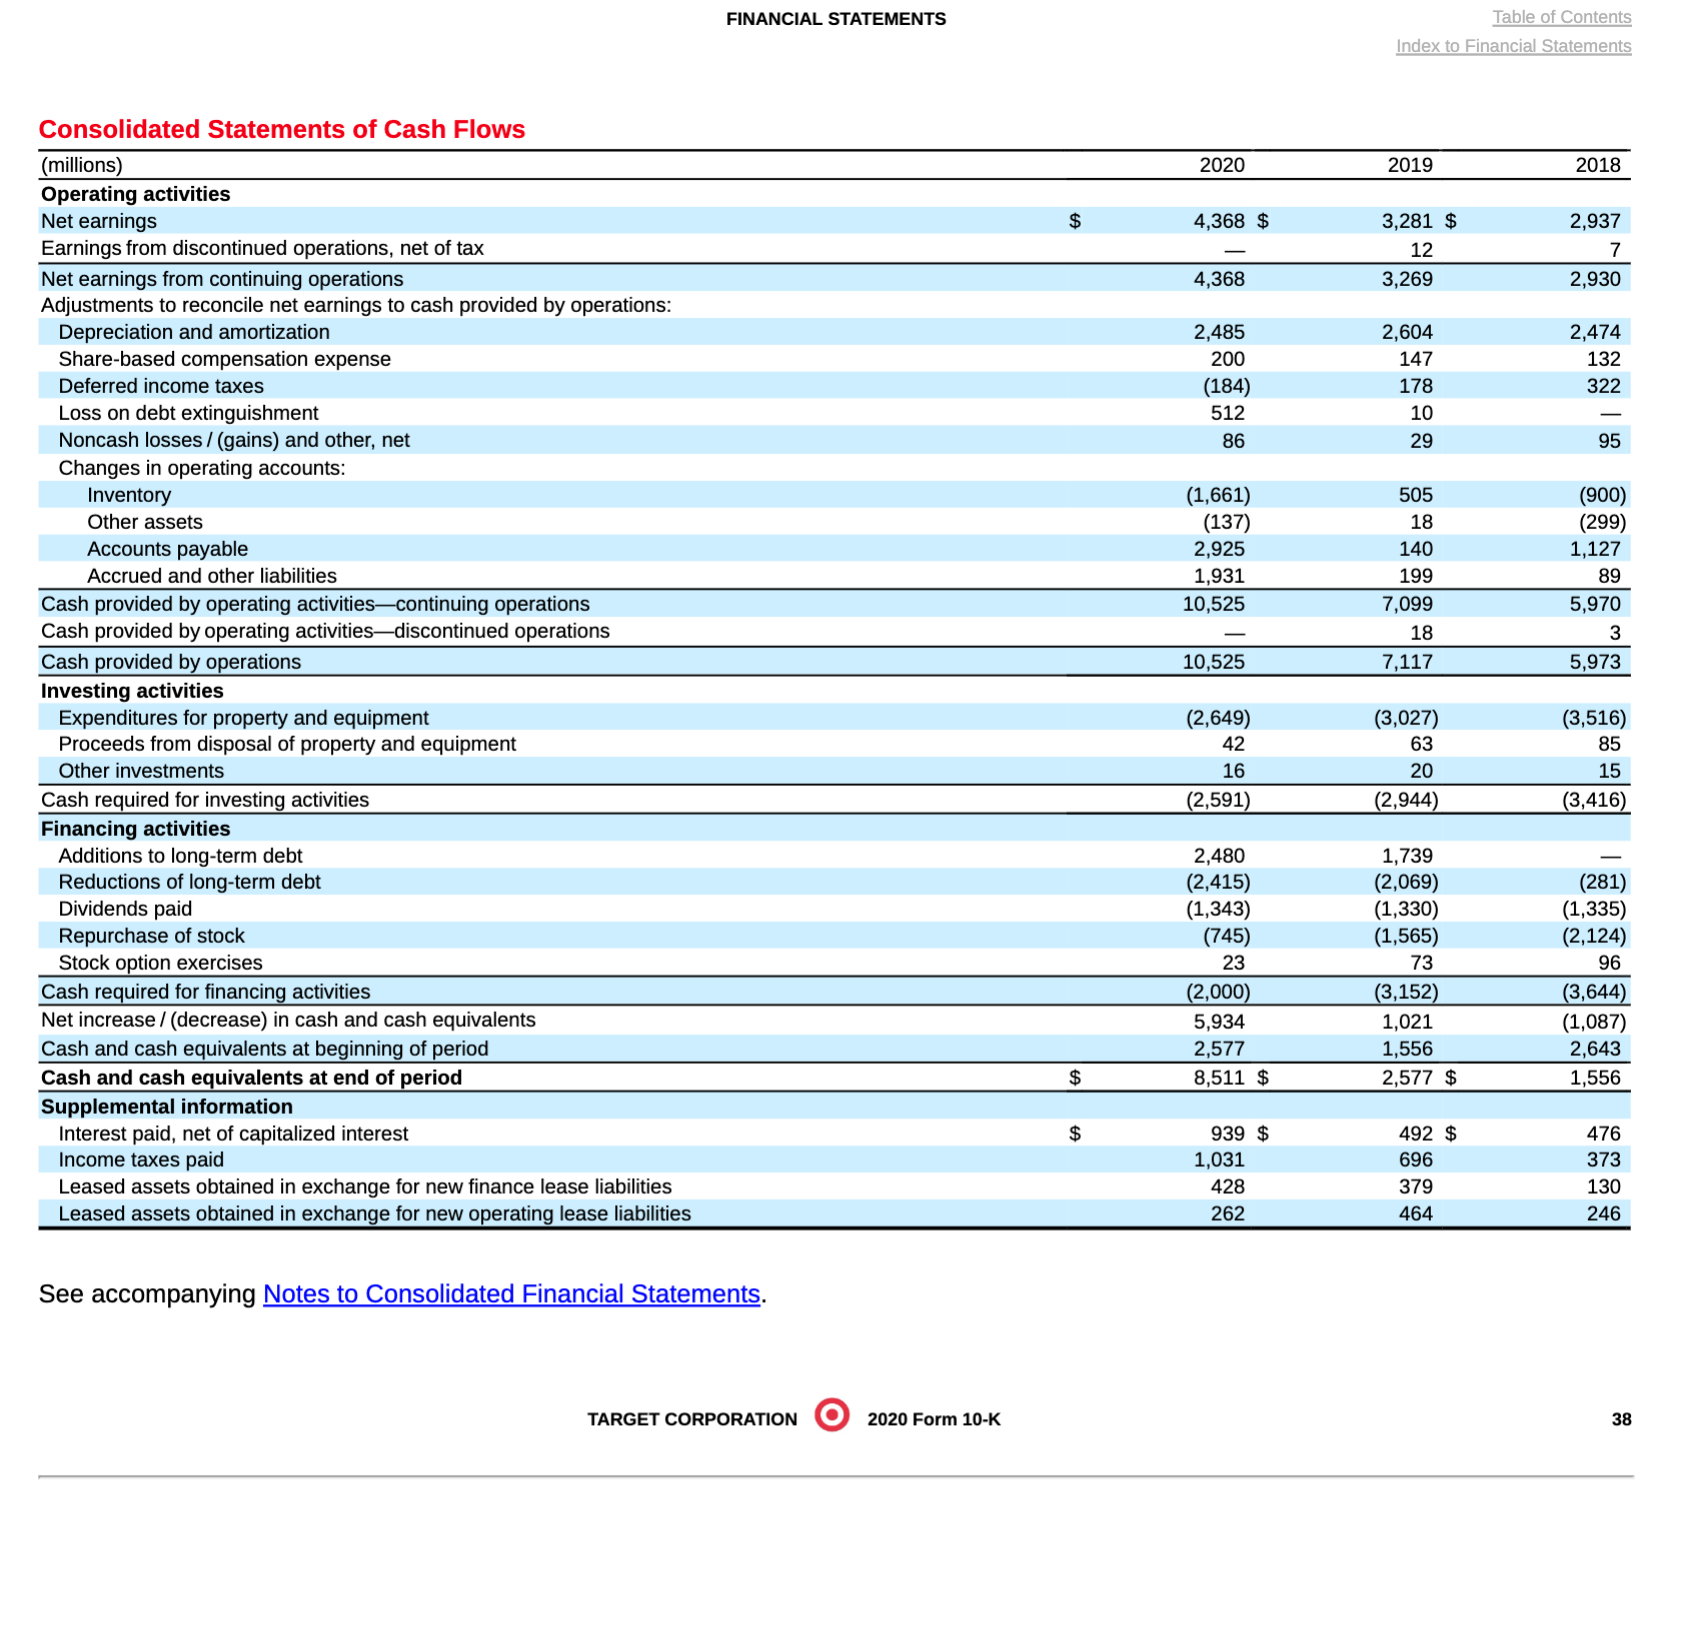
Name: Section: Student ID# PART 1: RATIO CALCULAION Walmart Target 2020 2019 2018 2020 2019 2018 Current ratio 61,897 0.80 77,477 Working capital (in Millions) Inventory turnover Days in inventory Accounts receivable turnover Average collection period Debt to assets ratio Return on Assets Asset turnover Return on equity (or common stockholders' equity) Profit margin Gross profit rate Earnings per share Payout ratio Free Cash Flows (in Millions)Walmart Inc. Consolidated Statements of Income Fiscal Years Ended January 31, (Amounts in millions, except per share data) 2020 2019 2018 Revenues: Net sales $ 519,926 $ 510,329 $ 495,761 Membership and other income 4.038 4.076 4.582 Total revenues 523,964 514,405 500,343 Costs and expenses: Cost of sales 394,605 385,301 373,396 Operating, selling, general and administrative expenses 108,791 107,147 106,510 Operating income 20,568 21,957 20,437 Interest: Debt 2,262 1,975 1,978 Finance, capital lease and financing obligations 337 371 352 Interest income (189) (217) (152) Interest, net 2,410 2,129 2,178 Loss on extinguishment of debt 3,136 Other (gains) and losses (1,958) 8,368 Income before income taxes 20,116 11,460 15,123 Provision for income taxes 4,915 4,281 4,600 Consolidated net income 15,201 7,179 10,523 Consolidated net income attributable to noncontrolling interest (320) (509) (661) Consolidated net income attributable to Walmart $ 14,881 $ 6,670 $ 9,862 Net income per common share: Basic net income per common share attributable to Walmart $ 5.22 $ 2.28 $ 3.29 Diluted net income per common share attributable to Walmart 5.19 2.26 3.28 Weighted-average common shares outstanding: Basic 2,850 2,929 2,995 Diluted 2,868 2,945 3,010 Dividends declared per common share $ 2.12 $ 2.08 $ 2.04walmart Inc. Consolidated Statements of Comprehensive Income Fiscal Years Ended January 31, (Amounts in millions) 2020 2019 2018 Consolidated net income 15,201 7,179 $ 10,523 Consolidated net income attributable to noncontrolling interest (320) (509) (661) Consolidated net income attributable to Walmart 14,881 6,670 9,862 Other comprehensive income (loss), net of income taxes Currency translation and other 286 (226) 2,540 Net investment hedges 122 272 (405) Cash flow hedges (399) (290) 437 Minimum pension liability (1,244) 131 147 Unrealized gain on available-for-sale securities 1,501 Other comprehensive income (loss), net of income taxes (1,235) (113) 4,220 Other comprehensive (income) loss attributable to noncontrolling interest (28) 188 (169) Other comprehensive income (loss) attributable to Walmart (1,263) 75 4,051 Comprehensive income, net of income taxes 13,966 7,066 14,743 Comprehensive income attributable to noncontrolling interest (348) (321) (830) Comprehensive income attributable to Walmart $ 13,618 $ 6,745 $ 13,913Walmart Inc. Consolidated Statements of Shareholders' Equity Accumulated Total Capital in Other Walmart Common Stock Excess of Retained Comprehensive Shareholders' Noncontrolling Total (Amounts in millions) Shares Amount Par Value Earnings Income (Loss) Equity Interest Equity Balances as of February 1, 2017 3,048 305 2,371 $ 89,354 $ (14,232) $ 77,798 $ 2,737 $ 80,535 Consolidated net income 9,862 9,862 661 10,523 Other comprehensive income (loss), net of income taxes 4,05 4,051 169 4,22 Cash dividends declared ($2.04 per share) (6,124) (6,124) (6,124) Purchase of Company stock (103) (10) 219) (7,975) (8,204) (8,204) Cash dividend declared to noncontrolling interest (687) (687 Other 7 496 (10) 486 73 559 Balances as of January 31, 2018 2,952 295 2,648 85,107 (10,181) 77,869 2,953 80,822 Adoption of new accounting standards on February 1, 2018, net of income taxes 2,361 (1,436) 925 (1) 924 Consolidated net income 5,670 6,670 509 7,179 Other comprehensive income (loss), net of income taxes - 75 75 (188) (113) Cash dividends declared ($2.08 per share) (6,102) (6,102) (6,102) Purchase of Company stock (80) (8 ) (245) (7,234) (7,487) (7,487) Cash dividend declared to noncontrolling interest (488) (488) Noncontrolling interest of acquired entity - 4,345 4,345 Other 6 1 562 (17) 546 554 Balances as of January 31, 2019 2,87 288 2,965 80,785 (11,542) 72,496 7,138 79,634 Adoption of new accounting standards on February 1, 2019, net of income taxes (266) 266) (34) (300) Consolidated net income 14,881 14,881 320 15,201 Other comprehensive income (loss), net of income taxes - (1,263) (1,263) 28 (1,235 Cash dividends declared ($2.12 per share) (6,048) (6,048) (6,048) Purchase of Company stock (53) (5) (199) (5,435) (5,639) (5,639) Cash dividends declared to noncontrolling interest - - (475) (475) Other 7 481 26 508 (94) 414 Balances as of January 31, 2020 2,832 $ 284 $ 3,247 $ 83,943 (12,805) $ 74,669 6,883 $ 81,552Walmart Inc. Consolidated Statements of Cash Flows Fiscal Years Ended January 31, (Amounts in millions) 2020 2019 2018 Cash flows from operating activities: Consolidated net income 15,201 7,179 $ 10,523 Adjustments to reconcile consolidated net income to net cash provided by operating activities: Depreciation and amortization 10,987 10,678 10,529 Unrealized (gains) and losses (1,886) 3,516 (Gains) and losses for disposal of business operations 15 4,850 Asda pension contribution (1,036) Deferred income taxes 320 (499) (304) Loss on extinguishment of debt 3,136 Other operating activities 1,981 1,734 1,210 Changes in certain assets and liabilities, net of effects of acquisitions: Receivables, net 154 (368) (1,074) Inventories (300) (1,311) (140) Accounts payable (274 ) 1,831 4,086 Accrued liabilities 186 183 928 Accrued income taxes (93 ) (40) (557) Net cash provided by operating activities 25,25 27,753 28,337 Cash flows from investing activities: Payments for property and equipment (10,705) (10,344) (10,051) Proceeds from the disposal of property and equipment 321 519 378 Proceeds from the disposal of certain operations 833 876 1,046 Payments for business acquisitions, net of cash acquired (56 ) (14,656) (375 Other investing activities 479 (431) (77) Net cash used in investing activities (9,128) 24,036) (9,079) Cash flows from financing activities: Net change in short-term borrowings (4,656) (53) 4,148 Proceeds from issuance of long-term debt ,492 15,872 7,476 Repayments of long-term debt (1,907) (3,784) (13,061) Premiums paid to extinguish debt (3,059) Dividends paid (6,048) (6,102) (6,124) Purchase of Company stock (5,717) (7,410) 8,296) Dividends paid to noncontrolling interest (555) (431) (690) Purchase of noncontrolling interest (8 ) Other financing activities (908) (629) (261) Net cash used in financing activities (14,299) (2,537) (19,875) Effect of exchange rates on cash, cash equivalents and restricted cash (69) (438) 487 Net increase (decrease) in cash, cash equivalents and restricted cash 1,759 742 (130) Cash, cash equivalents and restricted cash at beginning of year 7,756 ,014 7,144 Cash, cash equivalents and restricted cash at end of year $ 9,515 7,756 7.014 Supplemental disclosure of cash flow information: Income taxes paid $ 3,616 $ 3,982 6,179 Interest paid 2,464 2,348 2,450Consolidated Statements of Operations (millions, except per share data) 2020 2019 2018 Sales 92.400 $ 77.130 $ 74.433 Other revenue 1.161 982 923 Total revenue 93.561 78.112 75.356 Cost of sales 66.177 54.864 53.299 Selling. general and administrative expenses 18.615 16.233 15.723 Depreciation and amortization (exclusive of depreciation included in cost of sales) 2.230 2.357 2.224 Operating income 6.539 4.658 4.110 Net interest expense 977 477 461 Net other (income) I expense 16 (9) (27) Earnings from continuing operations before income taxes 5.546 4.190 3.676 Provision for income taxes 1.178 921 746 Net earnings from continuing operations 4.368 3.269 2.930 Discontinued operations. net of tax 12 7 Net earnings 4.368 $ 3.281 $ 2.937 Basic earnings per share Continuing operations 8.72 $ 6.39 $ 5.54 Discontinued operations 0.02 0.01 Net earnings per share 8.72 $ 6.42 $ 5.55 Diluted earnings per share Continuing operations 8.64 $ 6.34 $ 5.50 Discontinued operations 0.02 0.01 Net earnings per share 8.64 $ 6.36 $ 5.51 Weighted average common shares outstanding Basic 500.6 510.9 528.6 Diluted 505.4 515.6 533.2 Antidilutive shares Note: Per share amounts may not foot due to rounding. See accompanying 801W TARGET coupon-non 0 2020 Form 10-K as FINANCIAL STATEMENTS Table of Contents Index to Financial Statements Consolidated Statements of Comprehensive Income millions) 2020 2019 2018 Net earnings $ 4,368 $ 3,281 $ 2,937 Other comprehensive income / (loss), net of tax Pension benefit liabilities 102 (65) (52) Currency translation adjustment and cash flow hedges 10 2 (6) Other comprehensive income / (loss) 112 63) 58) Comprehensive income $ 4,480 $ 3,218 $ 2,879 See accompanying Notes to Consolidated Financial Statements. TARGET CORPORATION O 2 2020 Form 10-K 36Consolidated Statements of Financial Position (millions, except footnotes) January 30, 2021 February 1. 2020 Assets Cash and cash equivalents $ 8.511 $ 2,577 Inventory 10.653 8,992 Other current assets 1.592 1,333 Total current assets 20.756 12.902 Property and equipment Land 6.141 6,036 Buildings and improvements 31.557 30,603 Fixtures and equipment 5.914 6,083 Computer hardware and software 2.765 2,692 Construction-in-progress 780 533 Accumulated depreciation (20.278) (19.664) Property and equipment, net 26.879 26,283 Operating lease assets 2.227 2,236 Other noncurrent assets 1.386 1,358 Total assets 3 51.248 8 42.779 Liabilities and shareholders' investment Accounts payable 3 12.859 8 9.920 Accrued and other current liabilities 6.122 4,406 Current portion of long-term debt and other borrowings 1.144 161 Total current liabilities 20.125 14,487 Long-term debt and other borrowings 11.536 11.338 Noncurrent operating lease liabilities 2.218 2.275 Deferred income taxes 990 1,122 Other noncurrent liabilities 1.939 1.724 Total noncurrent liabilities 16.683 16.459 Shareholders' investment Common stock 42 42 Additional paid-in capital 6.329 6,226 Retained earnings 8.825 6.433 Accumulated other comprehensive loss (756) (868) Total shareholders' investment 14.440 11,833 Total liabilities and shareholders' investment $ 51.248 $ 42,779 Common Stock Authorized 6,000,000.000 shares. $00833 par value; 500.877.129 shares issued and outstanding as oi January 30, 2021; 504,198,962 shares issued and outstanding as of February 1. 2020. Preferred Stock Authorized 5.000.000 shares. $0.01 par value; no shares were issued or outstanding during any period presented. See accompanying Notes to Consolidated Financial Statements. FINANCIAL STATEMENTS Table of Contents Index to Finanmal Statements Consolidated Statements of Cash Flows (millions) 2020 2019 2018 Operating activities Net earnings $ 4,368 $ 3,261 $ 2,937 Earnings from discontinued operations, net of tax _ 12 7 Net earnings from continuing operations 4,368 3,269 2,930 Adjustments to reconcile net earnings to cash provided by operations: Depreciation and amortization 2,485 2,604 2,474 Share-based compensation expense 200 147 132 Deferred income taxes (184) 178 322 Loss on debt extinguishment 512 10 Noncash losses/(gains) and other, not 86 29 95 Changes in operating accounts: Inventory (1,661) 505 (900) Other assets (137) 18 (299) Accounts payable 2,925 140 1,127 Accrued and other liabilities 1,931 199 89 Cash provided by operating activitiescontinuing operations 10,525 7,099 5,970 Cash provided by operating activitiesdiscontinued operations 15 3 Cash provided by operations 10,525 7,117 5,973 Investing activities Expenditures for property and equipment (2,649) (3,027) (3,516) Proceeds from disposal of property and equipmem 42 63 85 Other investments 16 20 15 Cash re uired for investin activities 2,591 2,944 3,416 Financing activities Additions to longterm debt 2,480 1,739 Reductions of long-term debt (2,415) (2,069) (281) Dividends paid (1,343) (1,330) (1,335) Repurchase of stock (745) (1,565) (2,124) Stock option exercises 23 73 96 Cash re uired for nanci activities 2,000 3,152 3,644 Net increase.'(decrease) in cash and cash equivalents 5,934 1,021 (1,087) Cash and cash eguivalents at beginning of period 2,577 1,556 2,643 Cash and cash eguivalents at end of period $ 8,511 $ 2,577 $ 1,556 Supplemental information Interest paid, net of capitalized interest 5 939 $ 492 $ 476 Income taxes paid 1,031 696 373 Leased assets obtained in exchange for new nance lease liabilities 428 379 130 Leased assets obtained in exchange for new oErating lease liabilities 262 464 246 See accompanying Notes to Consolidated Financial Statements. TARGET CORPORATION Q 2020 Form III-K 38 FINANCIAL srATEMENTS Table of Contents Index to Financtai Statements Consolidated Statements of Shareholders' Investment Common Stock Additional Accumulated Other Stock Par Paid-in Retained Comprehensive (millions) Shares Value Capital Earnings (Loss) I Income Total February 3. 2018 541.7 8 45 $ 5.858 $ 6.495 $ (747)$ 11.651 Net earnings 2.937 2.937 Other comprehensive loss (58) (58) Dividends declared (1.347) (1.347) Repurchase of stock (27.2) (2) (2.068) (2.070) Stock options and awards 3.3 184 184 February 2. 2019 517.8 8 43 $ 6.042 $ 6.017 $ (805)$ 11.297 Net earnings 3.281 3.281 Other comprehensive loss (63) (63) Dividends declared (1.345) (1.345) Repurchase of stock (16.0) (1) (1.520) (1.521) Stock options and awards 2.4 184 184 February 1. 2020 504.2 35 42 $ 6.226 $ 5.433 $ (868)$ 11.833 Net earnings 4.368 4.368 Other comprehensive income 112 112 Dividends declared (1.367) (1.367) Repurchase of stock (5.7) (609) (609) Stock options and awards 2.4 103 103 January 30. 2021 500.9 5 42 $ 6.329 $ 8.825 $ (756)$ 14.440 We declared $2.70. $2.62. and $2.54 dividends per share for the twelve months ended January 30. 2021. February 1. 2020. and February 2. 2019. respectively. See accompanying Notes to Consolidated Financial Statements. TARGET CORPORATION O 2020 Form 10-K 39 UNITED STATES SECURITIES AND EXCHANGE COMMISSION Washington, D.C. 20549 FORM 10-K (Mark One) X ANNUAL REPORT PURSUANT TO SECTION 13 OR 15(d) OF THE SECURITIES EXCHANGE ACT OF 1934 For the fiscal year ended January 30, 2021 OR TRANSITION REPORT PURSUANT TO SECTION 13 OR 15(d) OF THE SECURITIES EXCHANGE ACT OF 1934 For the transition period from to Commission File Number 1-6049 TARGET CORPORATION (Exact name of registrant as specified in its charter) Minnesota (State or other jurisdiction of incorporation or organization) 1000 Nicollet Mall, Minneapolis, Minnesota (Address of principal executive offices)