Using the EXERCISE data set, run a repeated- measures ANOVA with two between-
subjects factors (SMOKE and SEX), and one within-subjects factor (PULSE 1 and
PULSE 2, call this TRIAL) . Use SAS for all your hypothesis testing at the ?= 0.05
level.
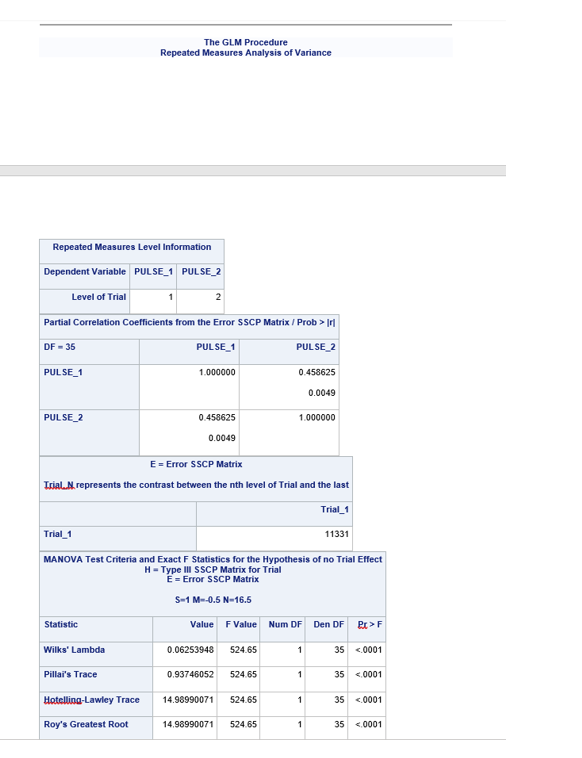
(a) Test the difference between PULSE 1 and PULSE 2. Report the p-value and the
observed test statistic and explain the results in terms of the language of the
problem.
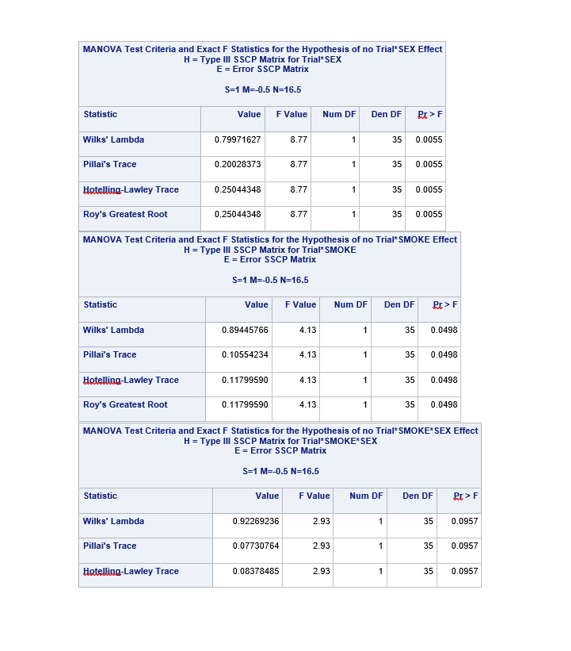
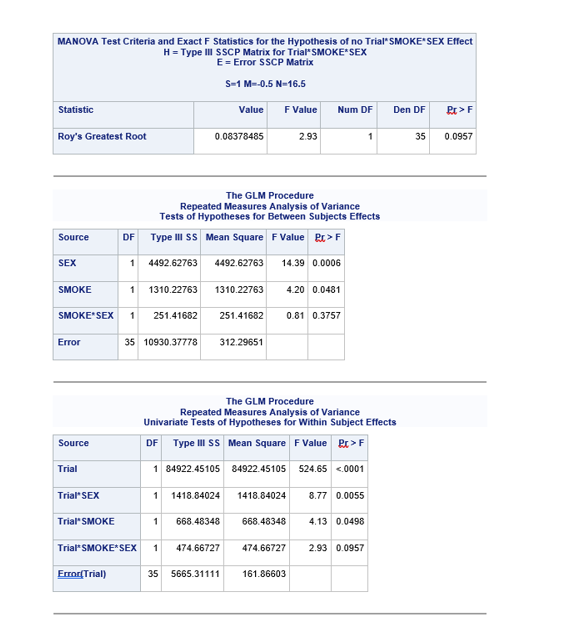
(b) what conclusion should be reached about the interaction between TRIAL and
SMOKE? Report the p-value and explain the results in terms of the language of
the problem.
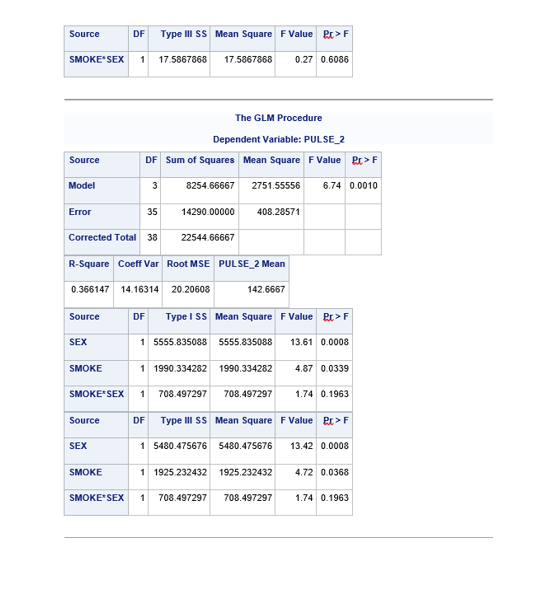
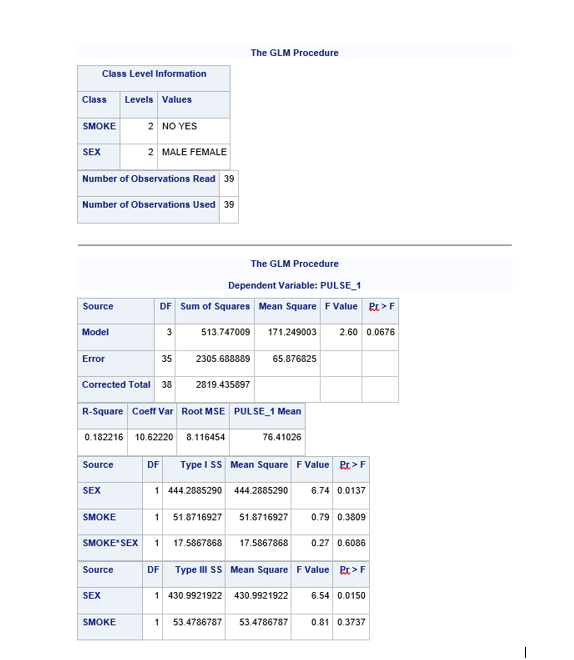
(c) Test the significance of the SMOKE*SEX interaction effect? C
(d) Test the main effects of SEX and SMOKE?
\fThe GLM Procedure Repeated Measures Analysis of Variance Repeated Measures Level Information Dependent Variable PULSE_1 PULSE_2 Level of Trial 2 Partial Correlation Coefficients from the Error SSCP Matrix / Prob > |~] DF - 35 PULSE_1 PULSE 2 PULSE_1 1.0 00000 0.458625 0.0049 PULSE_2 0 458625 1.000000 0.0049 E = Error SSCP Matrix Trial. N.represents the contrast between the nth level of Trial and the last Trial_1 Trial_1 11331 MANOVA Test Criteria and Exact F Statistics for the Hypothesis of no Trial Effect H = Type III SSCP Matrix for Trial E = Error SSCP Matrix 5-1 M--0.5 N-16.5 Statistic Value F Value Num DF Den DF Pr > F Wilks' Lambda 0.06253948 524.65 35 .0001 Pillai's Trace 0.93746052 524 65 35 F Wilks' Lambda 0.79971627 8.77 35 0.0055 Pillai's Trace 0.20028373 8,77 35 0.0055 Hotelling-Lawley Trace 0.25044348 8.77 0.0055 Roy's Greatest Root 0.25044348 8.77 35 0.0055 MANOVA Test Criteria and Exact F Statistics for the Hypothesis of no Trial' SMOKE Effect H - Type Ill SSCP Matrix for Trial" SMOKE E = Error SSCP Matrix 5-1 M--0.6 N-16.5 Statistic Value F Value Num DF Den OF P[ > F Wilks' Lambda 1.89445766 4.13 35 0_0498 Pillai's Trace 0.10554234 4.13 35 0 0495 Hotelling-Lawley Trace 0.11799590 1.13 1 35 0.0498 Roy's Greatest Root 0.11799590 4,13 15 0 0498 MANOVA Test Criteria and Exact F Statistics for the Hypothesis of no Trial* SMOKE* SEX Effect H = Type Ill SSCP Matrix for Trial" SMOKE* SEX E = Error SSCP Matrix S=1 M= 0.5 N=16.5 Statistic Value F Value Num DF Den DF Pr > F Wilks' Lambda 0.92269236 2.93 35 0.0957 Pillai's Trace 0.07730764 2.93 35 0.0957 Hotelling-Lawley Trace 0.08378485 2.93 35 0.0957MANOVA Test Criteria and Exact F Statistics for the Hypothesis of no Trial" SMOKE SEX Effect H = Type III SSCP Matrix for Trial" SMOKE" SEX E = Error SSCP Matrix S-1 M--0.5 N-16.5 Statistic Value F Value Num DF Den DF Pr > F Roy's Greatest Root 0.08378485 2.93 35 0.0957 The GLM Procedure Repeated Measures Analysis of Variance Tests of Hypotheses for Between Subjects Effects Source OF Type Ill $5 Mean Square F Value Pr > F SEX 4492.62763 4492.62763 14.39 0.0006 SMOKE 1310.22763 1310.22763 420 0.0481 SMOKE SEX 251.41682 251.41682 0.81 0.3757 Error 35 10930.37778 312.29651 The GLM Procedure Repeated Measures Analysis of Variance Univariate Tests of Hypotheses for Within Subject Effects Source DF Type lil SS Mean Square F Value P[ > F Trial 1 84922.45105 84922.45105 524.65 <.0001 trial sex i smoke error glm procedure class level information levels values no yes male female number of observations read used the dependent variable: pulse_1 source df sum squares mean square f value pr> F Model 513 747009 171.249003 2.60 0.0676 Error 35 2305 688889 65.876825 Corrected Total 2819.435897 R-Square Coelf Var Root MSE PULSE_1 Mean 0.182216 10.62220 8.116454 76,41026 Source DF Type I SS Mean Square F Value Pr > F SEX 1 444.2885290 444.2865290 6.74 0.0137 SMOKE 51.8716927 51.8716927 0.79 0.3809 SMOKE* SEX 1 17.5867868 17.5867868 0.27 0.6086 Source DF Type III SS Mean Square F Value P[ > F SEX 1 430.9921922 430.9921922 6.54 0.0150 SMOKE 53.4786787 53.4786787 0.81 0.3737