

Answered step by step
Verified Expert Solution
Question
1 Approved Answer
Using the experimental data for P analysis using autoanalyzer make a standard addition curve like above example curve for your data 2. Corrected Values, Channel::
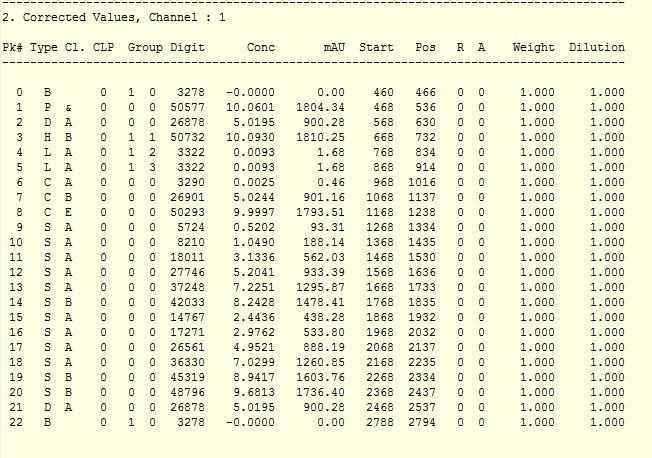
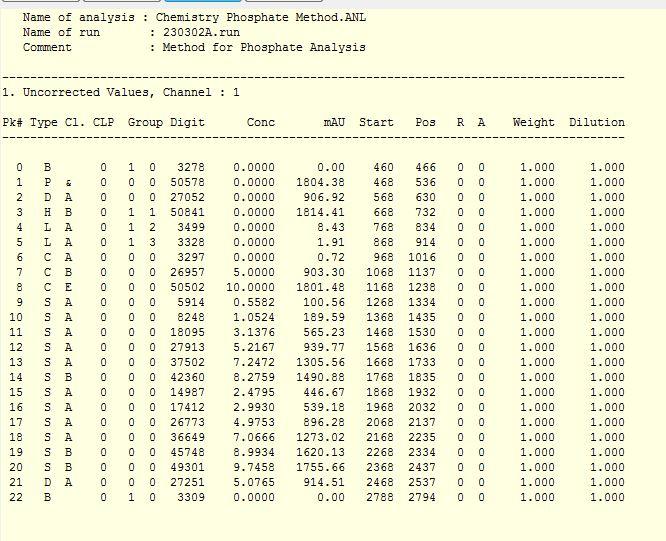
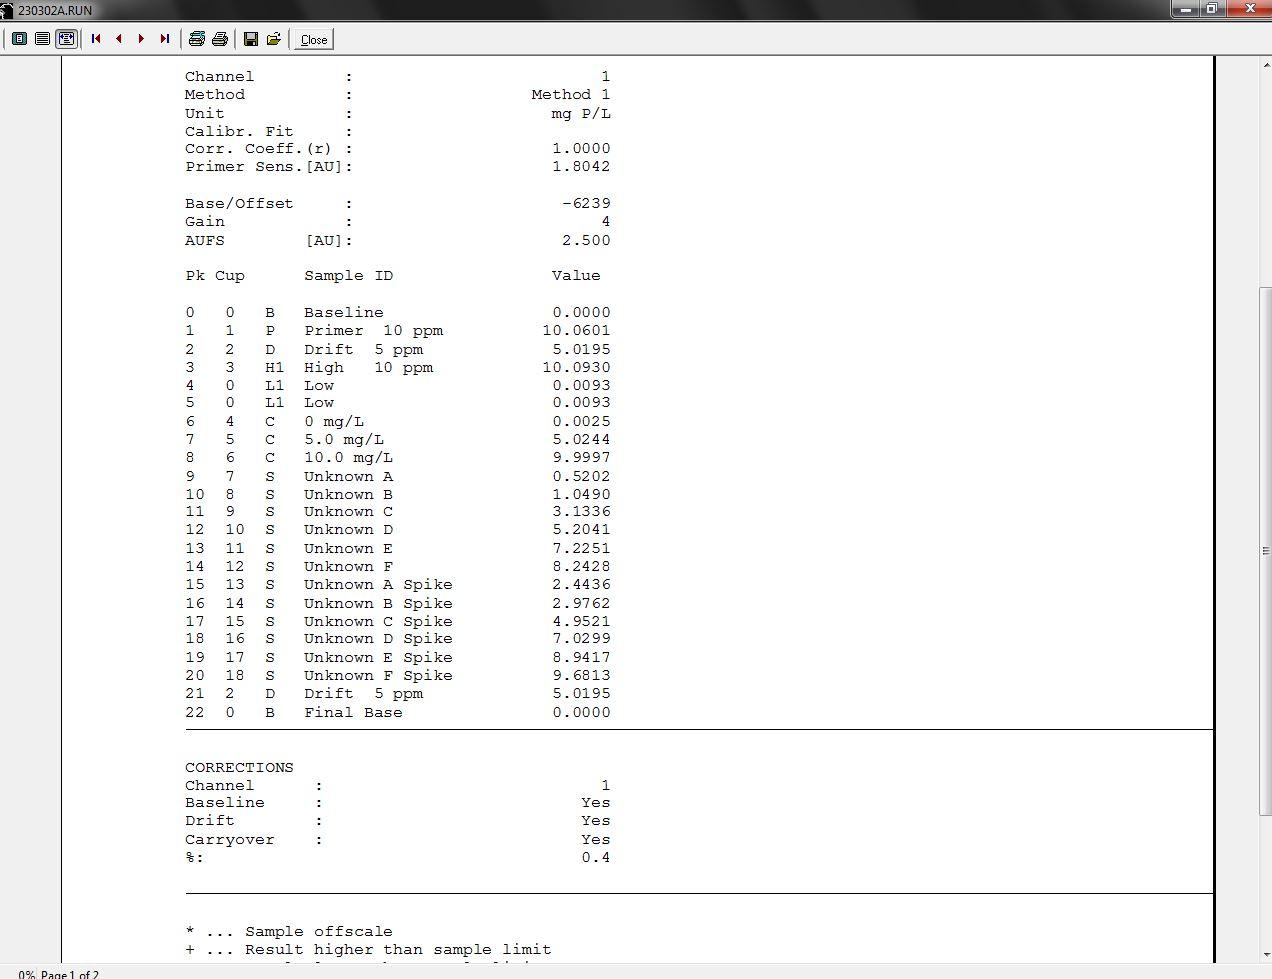
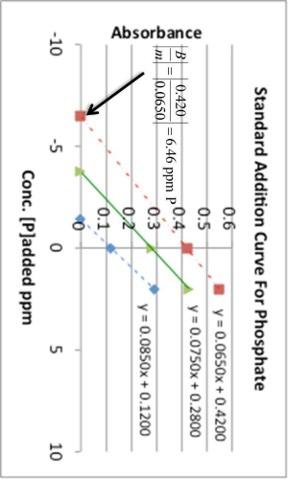
Using the experimental data for P analysis using autoanalyzer make a standard addition curve like above example curve for your data
2. Corrected Values, Channel:: 1 Pk\# Type Cl. CLP Group Digit Conc mAU Start Pos R A Weight Dilution Name of analysis : Chemistry Phosphate Method. ANL * .. Sample offscale + ... Result higher than sample limit Standard Addition Curve For Phosphate 2. Corrected Values, Channel:: 1 Pk\# Type Cl. CLP Group Digit Conc mAU Start Pos R A Weight Dilution Name of analysis : Chemistry Phosphate Method. ANL * .. Sample offscale + ... Result higher than sample limit Standard Addition Curve For PhosphateStep by Step Solution
There are 3 Steps involved in it
Step: 1

Get Instant Access to Expert-Tailored Solutions
See step-by-step solutions with expert insights and AI powered tools for academic success
Step: 2

Step: 3
Ace Your Homework with AI
Get the answers you need in no time with our AI-driven, step-by-step assistance
Get Started
Methane Conversion Routes Status And Prospects
Authors: Vladimir Galvita, René Bos
1st Edition
1788014308, 978-1788014304