Using the figure below, would area c ever be larger than area a? In other words, can you prove that a technological change that reduces compliance costs (lowers a polluter's MAC) could actually make the polluter worse off than without the technological change? Explain your result.
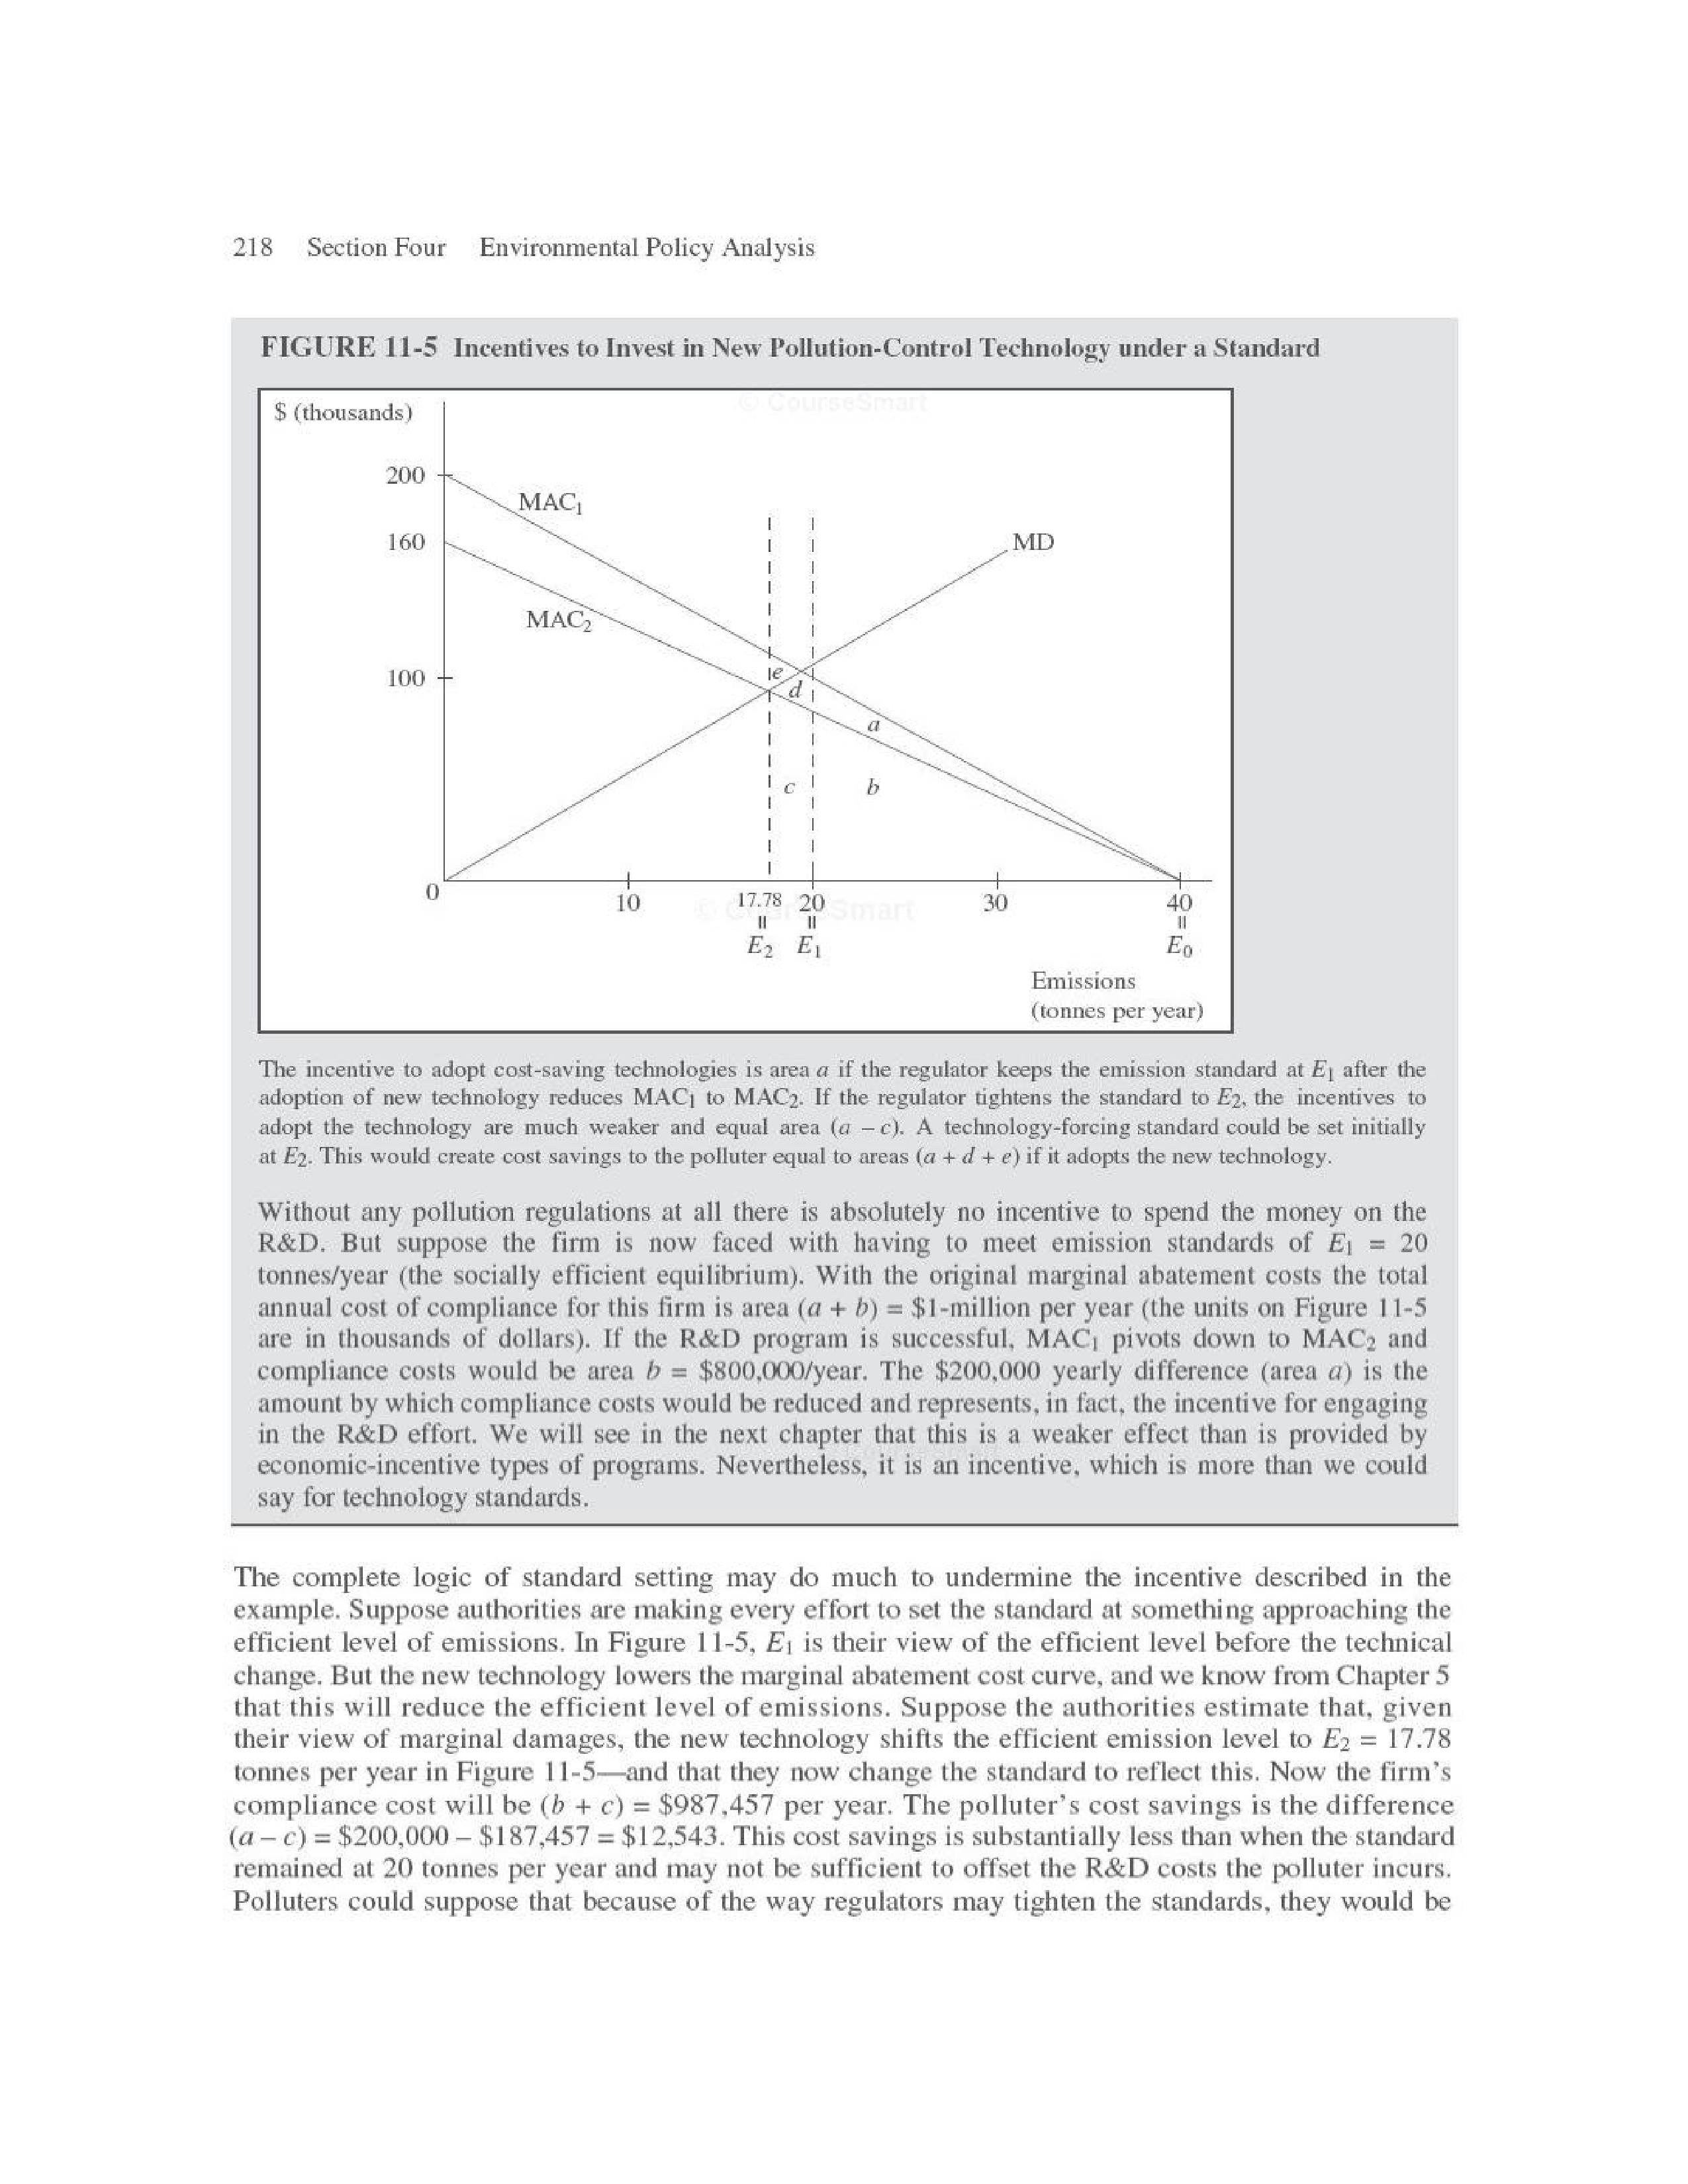
218 Section Four Environmental Policy Analysis FIGURE 11-5 Incentives to Invest in New Pollution-Control Technology under a Standard $ (thousands) 200 MAC 160 MD MAC2 100 - 10 17.78 20 fart 30 40 E, E Eo Emissions (tonnes per year) The incentive to adopt cost-saving technologies is area a if the regulator keeps the emission standard at E after the adoption of new technology reduces MAC, to MAC2. If the regulator tightens the standard to E2, the incentives to adopt the technology are much weaker and equal area (a - c). A technology-forcing standard could be set initially at E2. This would create cost savings to the polluter equal to areas (a + d + e) if it adopts the new technology. Without any pollution regulations at all there is absolutely no incentive to spend the money on the R&D. But suppose the firm is now faced with having to meet emission standards of El = 20 tonnes/year (the socially efficient equilibrium). With the original marginal abatement costs the total annual cost of compliance for this firm is area (a + b) = $1-million per year (the units on Figure 11-5 are in thousands of dollars). If the R&D program is successful, MAC, pivots down to MAC2 and compliance costs would be area b = $800,000/year. The $200,000 yearly difference (area a) is the amount by which compliance costs would be reduced and represents, in fact, the incentive for engaging in the R&D effort. We will see in the next chapter that this is a weaker effect than is provided by economic-incentive types of programs. Nevertheless, it is an incentive, which is more than we could say for technology standards. The complete logic of standard setting may do much to undermine the incentive described in the example. Suppose authorities are making every effort to set the standard at something approaching the efficient level of emissions. In Figure 11-5, Er is their view of the efficient level before the technical change. But the new technology lowers the marginal abatement cost curve, and we know from Chapter 5 that this will reduce the efficient level of emissions. Suppose the authorities estimate that, given their view of marginal damages, the new technology shifts the efficient emission level to E2 = 17.78 tonnes per year in Figure 11-5-and that they now change the standard to reflect this. Now the firm's compliance cost will be (b + c) = $987,457 per year. The polluter's cost savings is the difference (a - c) = $200,000 - $187,457 = $12,543. This cost savings is substantially less than when the standard remained at 20 tonnes per year and may not be sufficient to offset the R&D costs the polluter incurs. Polluters could suppose that because of the way regulators may tighten the standards, they would be