Using the financial ratios, perform a detailed financial analysis of Grandview Medical Center. Please do the following: use at least two ratios per category, discuss why the calculated ratios were selected, and discuss any trends, causes for concern, or acknowledgments, which could be identified over the three-year period (2016-2018).
Include and organize response according to the following subtitles: Profitability, Liquidity, Debt, and Asset Management.
Please ensure to include actual numbers in the submission field to support your argument.
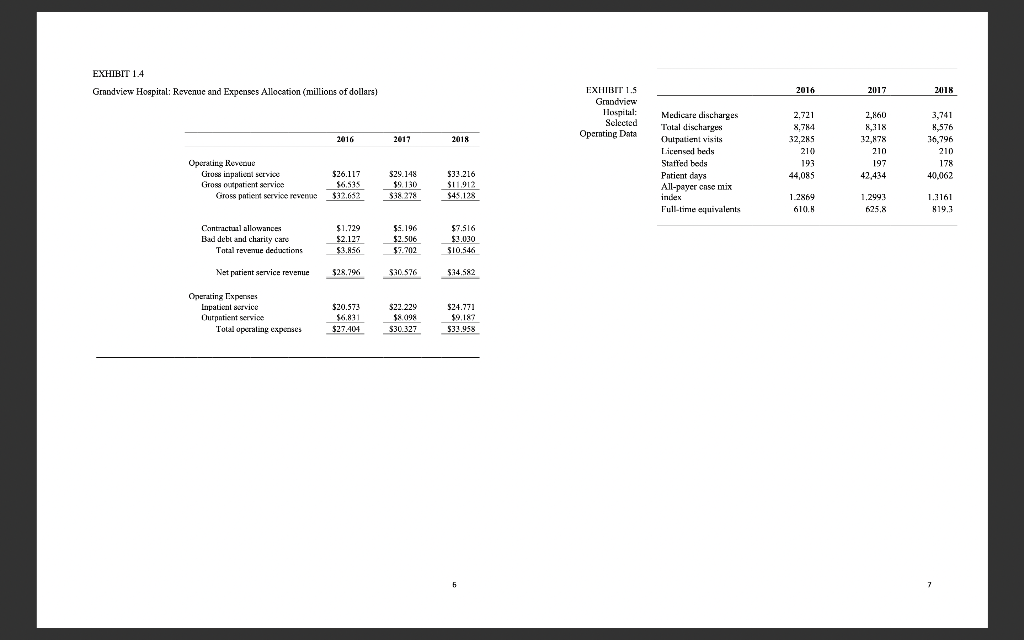
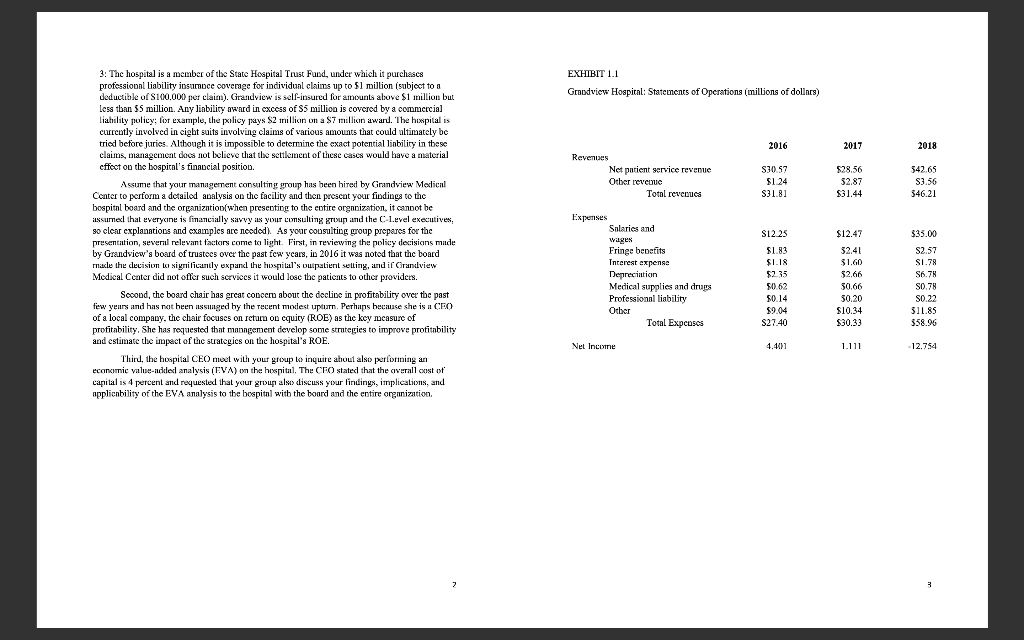
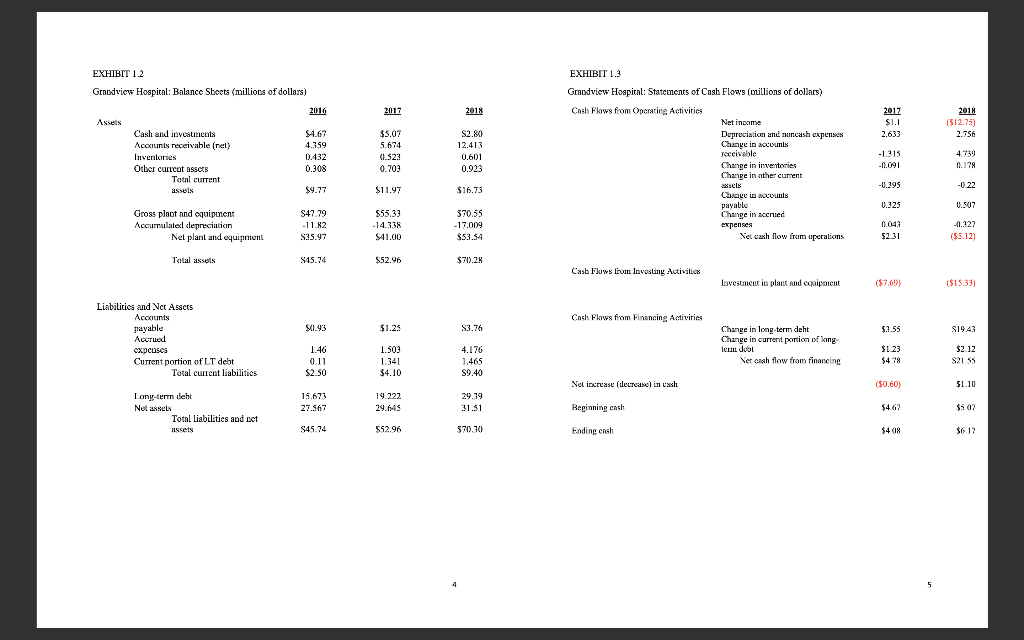
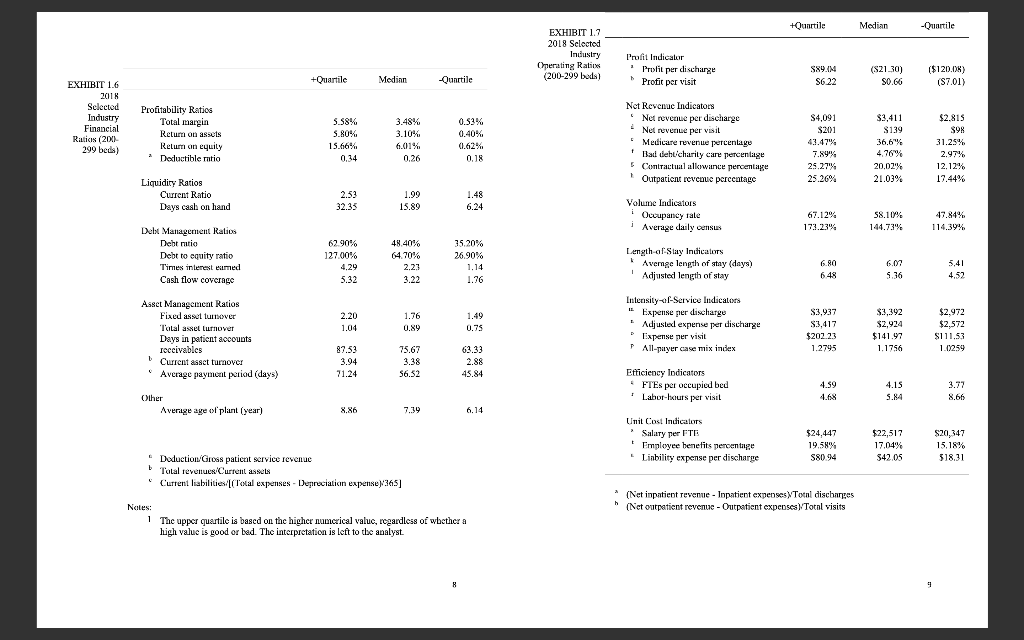

EXHIBIT 1.4 Grandview Hospital: Revenue and Expenses Allocation (millions of dollars) 2016 Operating Revenue $26.117 $6.535 $1.729 $2.127 $3.856 $28.796 $20.573 $6,831 $27.404 Gross inpatient service Gross outpatient service Gross patient service revenue Contractual allowances Bad debt and charity care Total revenue deductions Net patient service revenue Total operating expenses Operating Expenses Inpatient service Churpatient service 2017 $29.148 $9.130 $38.278 $5.196 $2.506 $7.702 $30.576 $22.229 $8.098 $30.327 2018 $33.216 $11.912 $45.128 $7.516 $3.030 $10.546 $34.582 $24.771 $9.187 $33.958 EXHIBIT 1.5 Grandview Hospital: Selected Operating Data Medicare discharges Total discharges Outpatient visits Licensed beds Staffed beds Patient days All-payer case mix index Full-time equivalents 2016 2,721 8.784 32,285 210 193 44,085 1.2869 610.8 2017 2.860 8,318 32,878 210 197 42,434 1.2993 625,8 2018 3,741 8,576 36,796 210 178 40,062 1.3161 819.3 7 3: The hospital is a member of the State Hospital Trust Fund, under which it purchases professional liability insurance coverage for individual claims up to $1 million (subject to a deductible of $100.000 per claim). Grandview is self-insured for amounts above $1 million but less than $5 million. Any liability award in excess of $5 million is covered by a commercial liability policy; for example, the policy pays $2 million on a $7 million award. The hospital is currently involved in cight suits involving claims of various amounts that could ultimately be tried before juries. Although it is impossible to determine the exact potential liability in these claims, management does not believe that the settlement of these cases would have a material effect on the hospital's financial position. Assume that your management consulting group has been hired by Grandview Medical Center to perform a detailed analysis on the facility and then present your findings to the hospital board and the organization(when presenting to the entire organization, it cannot be assured that everyone is financially savvy as your consulting group and the C-Level executives, so clear explanation and examples are needed). As your consulting group prepares for the presentation, several relevant factors come to light. First, in reviewing the policy decisions made by Grandview's board of trustees over the past few years, in 2016 it was noted that the board made the decision to significantly expand the hospital's outpatient setting, and if Grandview Medical Center did not offer such services it would lose the patients to other providers. Second, the board chair has great concern about the decline in profitability over the past few years and has not been assuaged by the recent modest upturn. Perhaps because she is a CEO of a local company, the chair focuses on return on equity (ROE) as the key measure of profitability. She has requested that management develop some strategies to improve profitability and estimate the impact of the strategies on the hospital's ROE. Third, the hospital CEO meet with your group to inquire about also performing an economic value-added analysis (EVA) on the hospital, The CEO stated that the overall cost of capital is 4 percent and requested that your group also discuss your findings, implications, and applicability of the EVA analysis to the hospital with the board and the entire organization. 2 EXHIBIT 1.1 Grandview Hospital: Statements of Operations (millions of dollars) 2016 Revenues $30.57 Net patient service revenue Other revenue $1.24 Total revenues $31.81 Expenses Salaries and $12.25 wages Fringe benefits $1.83 Interest expense $1.18 Depreciation $2.35 $0.62 Medical supplies and drugs Professional liability $0.14 Other $9.04 Total Expenses $27.40 4.401 Net Income 2017 $28.56 32.87 $31.44 $12.47 $2.41 $1.60 $2.66 $0.66 30.20 $10.34 $30.33 1.111 2018 342.65 $3.56 346.21 $35.00 $2.57 S1.78 S6.78 S0.78 SO.22 $11.85 $58.96 -12.754 3 EXHIBIT 1.2 Grandview Hospital: Balance Sheets (millions of dollars) 2016 Assets Cash and investments Accounts receivable (net) 4.359 Inventories 0.432 Other current assets 0.308 Total current assels $9.77 S47.79 Gross plant and equipment Accumulated depreciation -11.82 $35.97 $45.74 $0.93 1.46 0.11 $2.50 15.673 27.567 S45.74 Net plant and equipment Total assets Liabilities and Net Assets Accounts payable Accrued expenses Current portion of LT debt Long-term debt Net assets Total current liabilities Total liabilities and not assets 2017 $5.07 5.674 0.523 0.703 $11.97 $55.33 -14.338 $41.00 $52.96 $1.25 1.503 1.341 $4.10 19.222 29.645 $52.96 2018 S2.80 12,413 0.601 0.923 $16.73 370.55 -17.009 $53.54 $70.28 $3.76 4.176 1.465 $9.40 29.39 31.51 $70.30 EXHIBIT 1.3 Grandview Hospital: Statements of Cash Flows (millions of dollars) Cash Flows from Operating Activities. Net income Depreciation and noncash expenses Change in accounts receivable Change in inventories Change in other current assels Change in accounts payable Change in accrued expenses Cash Flows from Investing Activition Cash Flows from Financing Activities Net increase (decrease) in cash Beginning cash Ending cash Net cash flow from operations Investment in plant and equipment Change in long-term deht Change in current portion of long- term debl Net cash flow from financing 2017 $1.1 2.633 -1.315 -0.091 -0.395 0.325 0.043 $2.31 ($7.69) $3.55 $1.23 $4.78 ($0.60) $4.67 $4.08 2018 ($12.75) 2.756 4.739 0.178 -0.22 0.507 -0.327 ($5.12) ($15.33) $19.43 $2.12 $21.55 $1.10 $5.07 $6.17 EXHIBIT 1.6 2018 Selected Industry Financial Ratios (200 299 beds) Profitability Ratios Total margin Return on assets Retum on equity Deductible ratio 2 Liquidity Ratios +Quartile 3.48% 0.53% 3.10% 0.40% 6.01% 0.62% 0.26 0.18 Current Ratio 1.48 1.99 15.89 Days cash on hand 6.24 Debt Management Ratios Debt ratio 48.40% 64.70% 35.20% 26.90% Debt to equity ratio Times interest earned Cash flow coverage 2,23 1,14 3.22 1.76 Asset Management Ratios Fixed asset turnover 1.76 1.49 Total asset turnover 0.89 0.75 Days in patient accounts receivables 75.67 63.33 Current asset turnover 3.38 2.88 Average payment period (days) 56.52 45.84 Average age of plant (year) 7.39 6.14 Deduction/Gross patient service revenue b Total revenues/Current assets Current liabilities/[(Total expenses - Depreciation expense)/365] Notes: 1 The upper quartile is based on the higher numerical value, regardless of whether a high value is good or bad. The interpretation is left to the analyst. 8 Other 5.58% 5.80% 15.66% 0,34 2.53 32.35 Median 62.90% 127.00% 4.29 5.32 2.20 1.04 87.53 3.94 71.24 -Quartile EXHIBIT 1.7 2018 Selected. Industry Operating Ratios (200-299 beds) +Quartile Profit Indicator Profit per discharge $89.04 S6.22 b Profit per visit Net Revenue Indicators * Net revenue per discharge Net revenue per visit *Medicare revenue percentage $4,091 $201 43.47% f 7.89% Bad debt/charity care percentage Contractual allowance percentage 25.27% 1 Outpatient revenue percentage 25.26% Volume Indicators i Occupancy rate 67.12% 173.23% i Average daily census Length-of-Stay Indicators k Average length of stay (days) I Adjusted length of stay 6.80 6.48 $3,937 Intensity-of-Service Indicators "Expense per discharge Adjusted expense per discharge Expense per visit $3,417 $202.23 PAll-payer case mix index 1.2795 Efficiency Indicators *FTEs per occupied bed 4.59 * Labor-hours per visit Unit Cost Indicators * Salary per FTE $24,447 19.58% Employee benefits percentage *Liability expense per discharge S80.94 * (Net inpatient revenue - Inpatient expenses/Total discharges (Net outpatient revenue - Outpatient expenses)/Total visits Median ($21.30) $0.66 $3,411 $139 36.6% 4.76% 20.02% 21.03% 58,10% 144.73% 6.07 5.36 $3,392 $2,924 $141.97 1.1756 4.15 5.84 $22,517 17.04% $42.05 -Quartile ($120.08) (S7.01) $2,815 $98 31.25% 2.97% 12.12% 17.44% 47.84% 114.39% 5,41 4.52 $2,972 $2,572 $111.53 1.0259 3.77 8.66 $20,347 15.18% $18,31 9 Net inpatient revenue/Total discharges Net outpatient revenue/Total visits Medicare net patient revenue/Total net patient revenue ( (Bed d d debt Charity care)Cross patient revenue * Contractual allowances/Cross patient revenue *Net outpatient revenue/Total net patient revenue Patient days/(Staffed beds X 365) Patient days/365 * Patient days/Total discharges Average length of stay Case mix index Inpatient expenses/Total discharges Expense per discharge/Case mix index * Outpatient expenses/Total visits Sum of DRG weights/Total discharges Inpatient FTEs/Average daily census (Outpatient FTES X 2,080)/Total visits Total salaries/Total FTES Fringe benefit expense/Total salaries * Inpatient professional liability expense/Total discharges DRG: Diagnosis-related group; FTE: full-time equivalent Notes: 1 The upper quartile is based on the higher numerical value for the ratio and the lower quartile on the lower numerical value, regardless of whether a high value is good or bad. The interpretation is left to the analyst. 10


