

Question
Using the financial statements for the Hayden Manufacturing Company, please create a working spreadsheet of the statements and, for both 2020 and 2019, calculate each
Using the financial statements for the Hayden Manufacturing Company, please create a working spreadsheet of the statements and, for both 2020 and 2019, calculate each of the ratios covered in the Financial Analysis Module.
Ratios Include:
Liquidity Ratio
Current Ratio
Quick Ratio
Activity Ratios
Leverage Ratio
Asset Ratio
Equity Ratio
Equity Multiplier Ratio
Times Interest Earned Ratio
Profitability Ratio
Earning Power Ratio
Market Ratio
Price Earnings Ratio
Retention Rate or Plowback Ratio
Market to Book Value Ratio
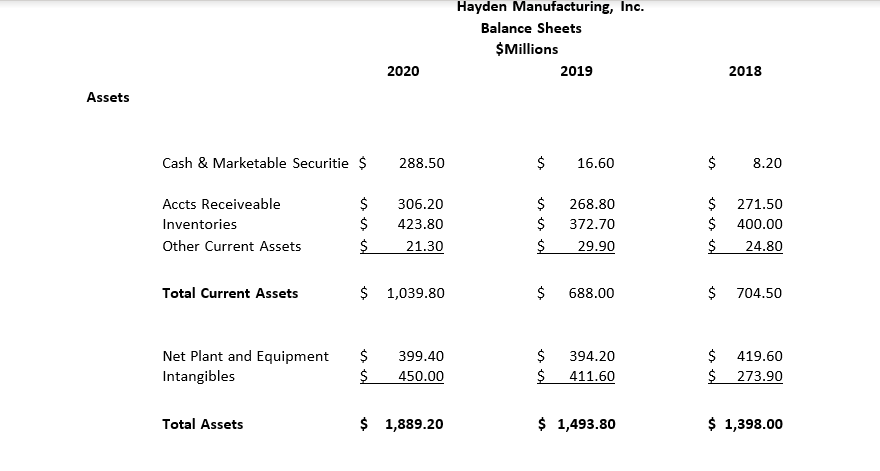
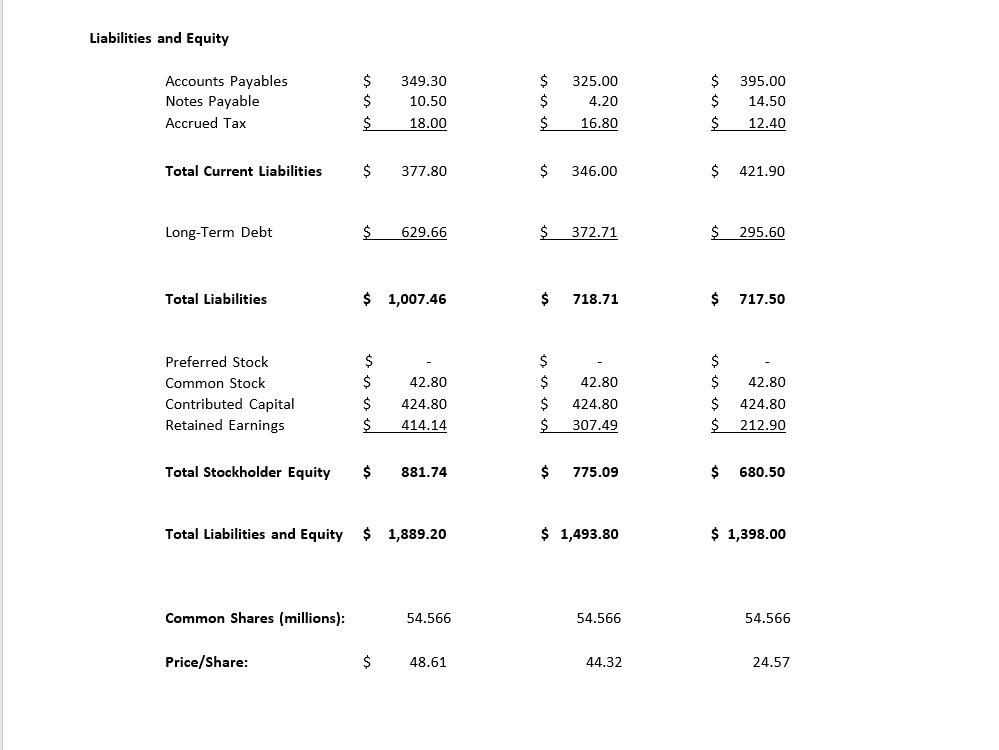
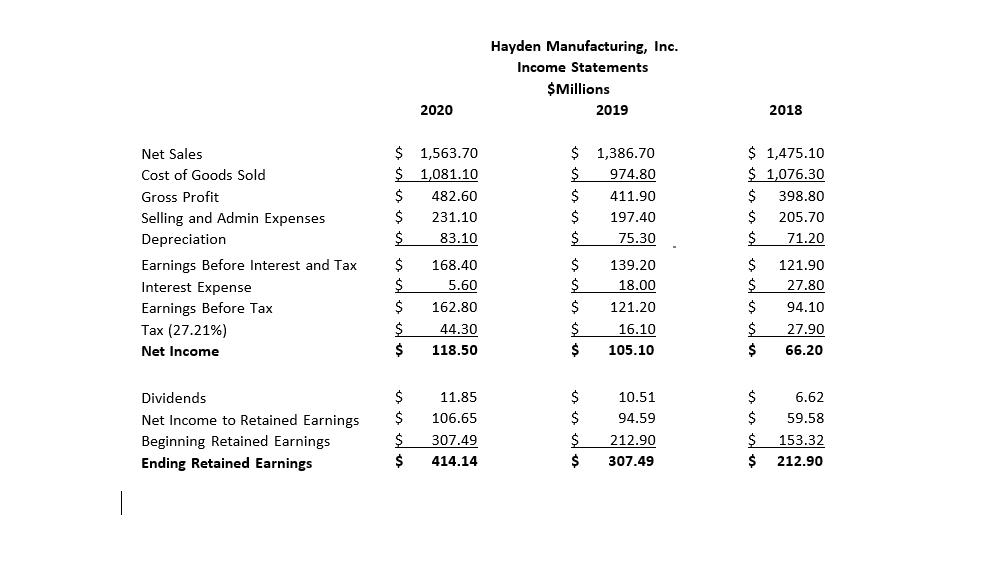
Hayden Manufacturing, Inc. Balance Sheets $Millions 2019 2020 2018 Assets Cash & Marketable Securitie $ 288.50 $ 16.60 $ 8.20 $ Accts Receiveable Inventories Other Current Assets $ $ $ 306.20 423.80 21.30 268.80 372.70 29.90 $ $ $ $ 271.50 400.00 24.80 est Total Current Assets $ 1,039.80 $ 688.00 $ 704.50 $ Net Plant and Equipment Intangibles $ $ 399.40 450.00 $ $ 394.20 411.60 419.60 $ 273.90 Total Assets $ 1,889.20 $ 1,493.80 $ 1,398.00 Liabilities and Equity $ is Accounts Payables Notes Payable Accrued Tax 349.30 10.50 18.00 $ $ $ 325.00 4.20 16.80 $ $ 395.00 14.50 12.40 $ Total Current Liabilities 377.80 $ 346.00 $ 421.90 Long-Term Debt $ 629.66 $ 372.71 $ 295.60 Total Liabilities $ 1,007.46 $ 718.71 717.50 $ $ Preferred Stock Common Stock Contributed Capital Retained Earnings $ $ $ $ 42.80 424.80 414.14 $ 42.80 424.80 307.49 es 42.80 424.80 212.90 Total Stockholder Equity $ 881.74 $ 775.09 680.50 Total Liabilities and Equity 1,889.20 $ 1,493.80 $ 1,398.00 Common Shares (millions): 54.566 54.566 54.566 Price/Share: $ 48.61 44.32 24.57 Hayden Manufacturing, Inc. Income Statements $Millions 2019 2020 2018 $ 1,563.70 $ 1,081.10 482.60 231.10 $ $ $ $ 1,475.10 $ 1,076.30 $ 398.80 $ 205.70 $ 71.20 es 83.10 Net Sales Cost of Goods Sold Gross Profit Selling and Admin Expenses Depreciation Earnings Before Interest and Tax Interest Expense Earnings Before Tax Tax (27.21%) Net Income $ 1,386.70 $ 974.80 $ 411.90 197.40 $ 75.30 $ 139.20 $ 18.00 $ 121.20 $ 16.10 $ 105.10 $ $ 168.40 5.60 162.80 44.30 118.50 $ $ $ $ $ 121.90 27.80 94.10 27.90 66.20 $ $ $ $ Dividends Net Income to Retained Earnings Beginning Retained Earnings Ending Retained Earnings 11.85 106.65 307.49 414.14 10.51 94.59 212.90 307.49 $ $ $ $ 6.62 59.58 153.32 212.90 $ $ $Step by Step Solution
There are 3 Steps involved in it
Step: 1

Get Instant Access to Expert-Tailored Solutions
See step-by-step solutions with expert insights and AI powered tools for academic success
Step: 2

Step: 3
Ace Your Homework with AI
Get the answers you need in no time with our AI-driven, step-by-step assistance
Get Started
Cima Official Exam Practice Kit Fundamentals Of Ethics Corporate Governance And Business Law Certificate In Business Accounting
Authors: Larry Mead
4th Edition
1856177092, 978-1856177092