

Answered step by step
Verified Expert Solution
Question
1 Approved Answer
Using the following information build a dcf valuation on excel. Diluted NI Available to Com Stock... 20,894 -817,120 -445,324 38,809 224,443 Basic EPS -12.15 -6.65
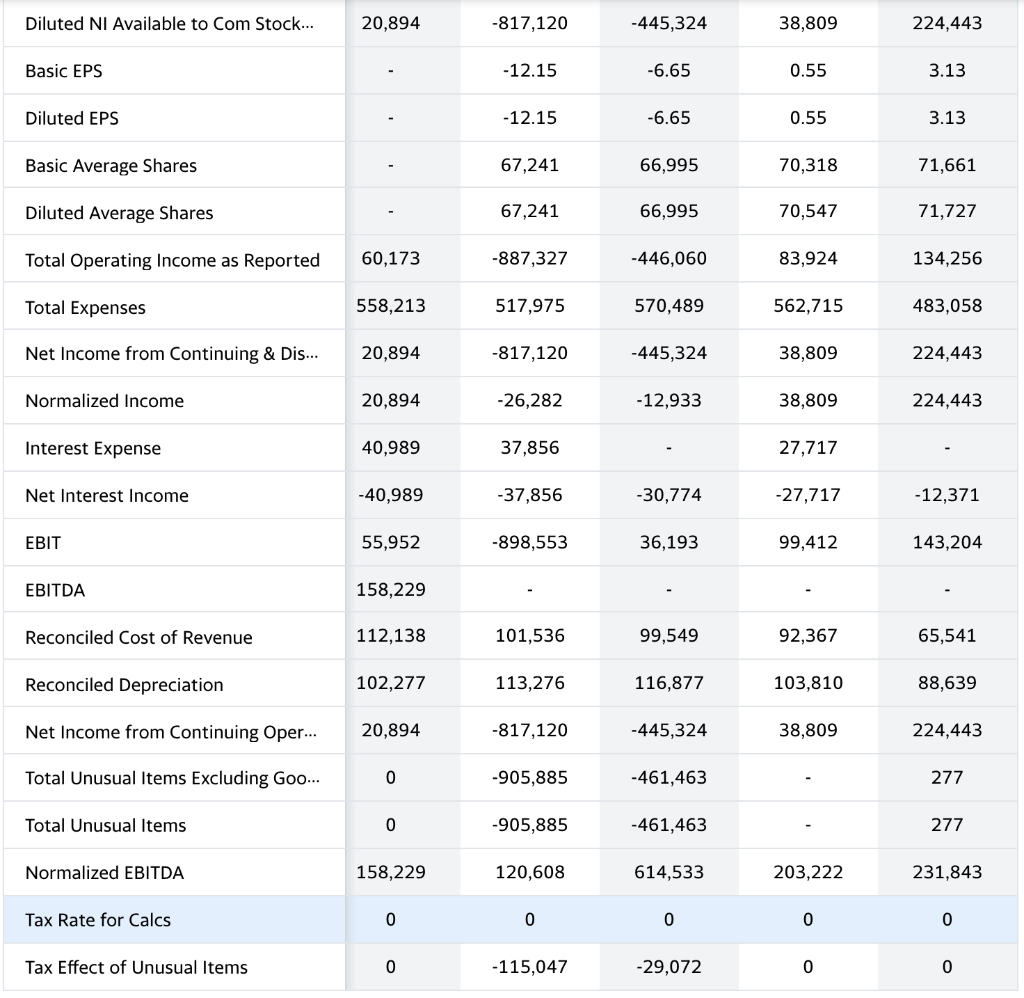
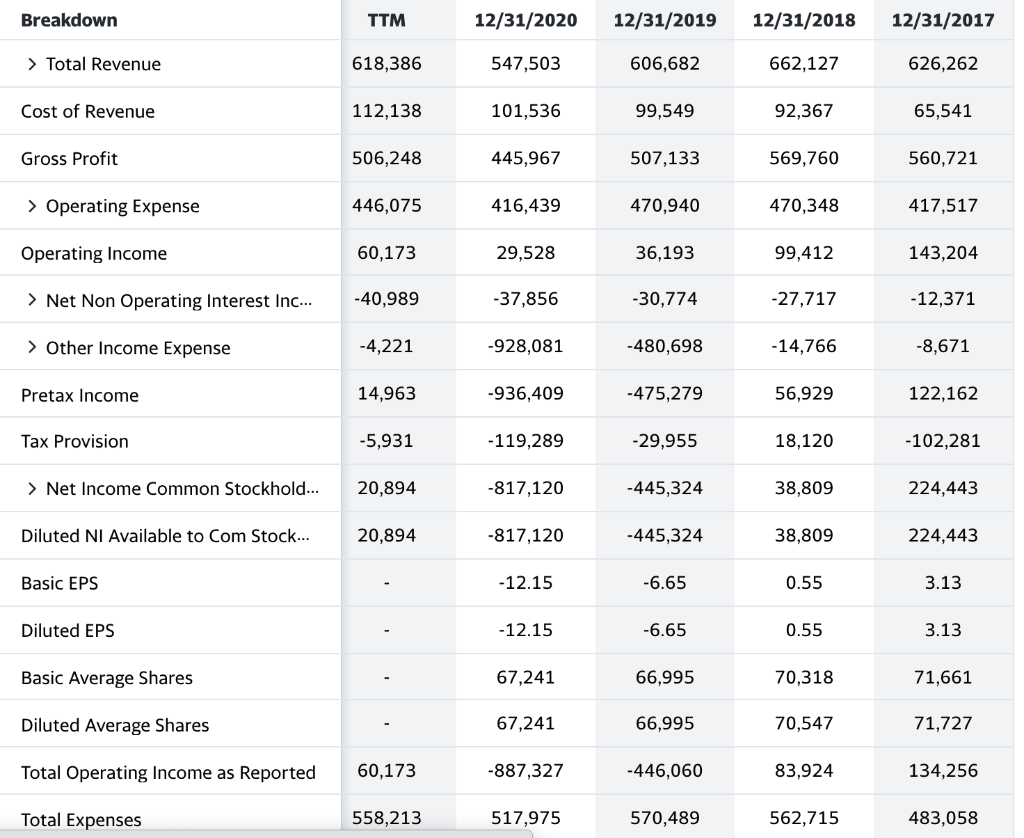
Using the following information build a dcf valuation on excel.
Diluted NI Available to Com Stock... 20,894 -817,120 -445,324 38,809 224,443 Basic EPS -12.15 -6.65 0.55 3.13 Diluted EPS -12.15 -6.65 0.55 3.13 Basic Average Shares 67,241 66,995 70,318 71,661 Diluted Average Shares 67,241 66,995 70,547 71,727 Total Operating Income as Reported 60,173 -887,327 -446,060 83,924 134,256 Total Expenses 558,213 517,975 570,489 562,715 483,058 Net Income from Continuing & Dis... 20,894 -817,120 -445,324 38,809 224,443 Normalized Income 20,894 -26,282 -12,933 38,809 224,443 Interest Expense 40,989 37,856 27,717 Net Interest Income -40,989 -37,856 -30,774 -27,717 -12,371 EBIT 55,952 -898,553 36,193 99,412 143,204 EBITDA 158,229 Reconciled Cost of Revenue 112,138 101,536 99,549 92,367 65,541 Reconciled Depreciation 102,277 113,276 116,877 103,810 88,639 Net Income from Continuing Oper... 20,894 -817,120 -445,324 38,809 224,443 Total Unusual Items Excluding Goo... 0 -905,885 -461,463 277 Total Unusual Items 0 -905,885 -461,463 277 Normalized EBITDA 158,229 120,608 614,533 203,222 231,843 Tax Rate for Calcs 0 0 0 0 Tax Effect of Unusual Items 0 -115,047 -29,072 0 0 Breakdown TTM 12/31/2020 12/31/2019 12/31/2018 12/31/2017 > Total Revenue 618,386 547,503 606,682 662,127 626,262 Cost of Revenue 112,138 101,536 99,549 92,367 65,541 Gross Profit 506,248 445,967 507,133 569,760 560,721 > Operating Expense 446,075 416,439 470,940 470,348 417,517 Operating Income 60,173 29,528 36,193 99,412 143,204 > Net Non Operating Interest Inc... -40,989 -37,856 -30,774 -27,717 -12,371 > Other Income Expense -4,221 -928,081 -480,698 -14,766 -8,671 Pretax Income 14,963 -936,409 -475,279 56,929 122,162 Tax Provision -5,931 -119,289 -29,955 18,120 -102,281 > Net Income Common Stockhold... 20,894 -817,120 -445,324 38,809 224,443 Diluted NI Available to Com Stock... 20,894 -817,120 -445,324 38,809 224,443 Basic EPS -12.15 -6.65 0.55 3.13 Diluted EPS -12.15 -6.65 0.55 3.13 Basic Average Shares 67,241 66,995 70,318 71,661 Diluted Average Shares 67,241 66,995 70,547 71,727 Total Operating Income as Reported 60,173 -887,327 -446,060 83,924 134,256 Total Expenses 558,213 517,975 570,489 562,715 483,058 Diluted NI Available to Com Stock... 20,894 -817,120 -445,324 38,809 224,443 Basic EPS -12.15 -6.65 0.55 3.13 Diluted EPS -12.15 -6.65 0.55 3.13 Basic Average Shares 67,241 66,995 70,318 71,661 Diluted Average Shares 67,241 66,995 70,547 71,727 Total Operating Income as Reported 60,173 -887,327 -446,060 83,924 134,256 Total Expenses 558,213 517,975 570,489 562,715 483,058 Net Income from Continuing & Dis... 20,894 -817,120 -445,324 38,809 224,443 Normalized Income 20,894 -26,282 -12,933 38,809 224,443 Interest Expense 40,989 37,856 27,717 Net Interest Income -40,989 -37,856 -30,774 -27,717 -12,371 EBIT 55,952 -898,553 36,193 99,412 143,204 EBITDA 158,229 Reconciled Cost of Revenue 112,138 101,536 99,549 92,367 65,541 Reconciled Depreciation 102,277 113,276 116,877 103,810 88,639 Net Income from Continuing Oper... 20,894 -817,120 -445,324 38,809 224,443 Total Unusual Items Excluding Goo... 0 -905,885 -461,463 277 Total Unusual Items 0 -905,885 -461,463 277 Normalized EBITDA 158,229 120,608 614,533 203,222 231,843 Tax Rate for Calcs 0 0 0 0 Tax Effect of Unusual Items 0 -115,047 -29,072 0 0 Breakdown TTM 12/31/2020 12/31/2019 12/31/2018 12/31/2017 > Total Revenue 618,386 547,503 606,682 662,127 626,262 Cost of Revenue 112,138 101,536 99,549 92,367 65,541 Gross Profit 506,248 445,967 507,133 569,760 560,721 > Operating Expense 446,075 416,439 470,940 470,348 417,517 Operating Income 60,173 29,528 36,193 99,412 143,204 > Net Non Operating Interest Inc... -40,989 -37,856 -30,774 -27,717 -12,371 > Other Income Expense -4,221 -928,081 -480,698 -14,766 -8,671 Pretax Income 14,963 -936,409 -475,279 56,929 122,162 Tax Provision -5,931 -119,289 -29,955 18,120 -102,281 > Net Income Common Stockhold... 20,894 -817,120 -445,324 38,809 224,443 Diluted NI Available to Com Stock... 20,894 -817,120 -445,324 38,809 224,443 Basic EPS -12.15 -6.65 0.55 3.13 Diluted EPS -12.15 -6.65 0.55 3.13 Basic Average Shares 67,241 66,995 70,318 71,661 Diluted Average Shares 67,241 66,995 70,547 71,727 Total Operating Income as Reported 60,173 -887,327 -446,060 83,924 134,256 Total Expenses 558,213 517,975 570,489 562,715 483,058Step by Step Solution
There are 3 Steps involved in it
Step: 1

Get Instant Access to Expert-Tailored Solutions
See step-by-step solutions with expert insights and AI powered tools for academic success
Step: 2

Step: 3
Ace Your Homework with AI
Get the answers you need in no time with our AI-driven, step-by-step assistance
Get Started
Finance Growth And Inequality
Authors: Louis-Philippe Rochon, Virginie Monvoisin
1st Edition
1788973682, 978-1788973687