

Question
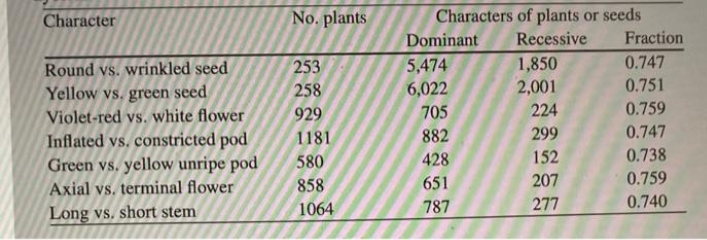
using the following table, identify the parent distribution P(n) that describes the probability that X=n plants display the dominant character and the rest ressesive.b) calculate
using the following table, identify the parent distribution P(n) that describes the probability that X=n plants display the dominant character and the rest ressesive.b) calculate the uncertainty in the number of plants that display the dominant character.c)determine the difference between the number of measured planrs with the dominant character and the expected number. normalize the figference by tje standard dev of the number of dominants z=(x-E[X])/sigma to show that this number has an absolute value of less than one
Step by Step Solution
There are 3 Steps involved in it
Step: 1

Get Instant Access to Expert-Tailored Solutions
See step-by-step solutions with expert insights and AI powered tools for academic success
Step: 2

Step: 3
Ace Your Homework with AI
Get the answers you need in no time with our AI-driven, step-by-step assistance
Get Started
WebAssign For A First Course In Differential Equations With Modeling Applications
Authors: Dennis G Zill
11th Edition
1337879770, 9781337879774