Answered step by step
Verified Expert Solution
Question
1 Approved Answer
Using the formula, count how many successful, failed, and canceled projects were created with goals within the ranges listed above. Populate the Number Failed, and
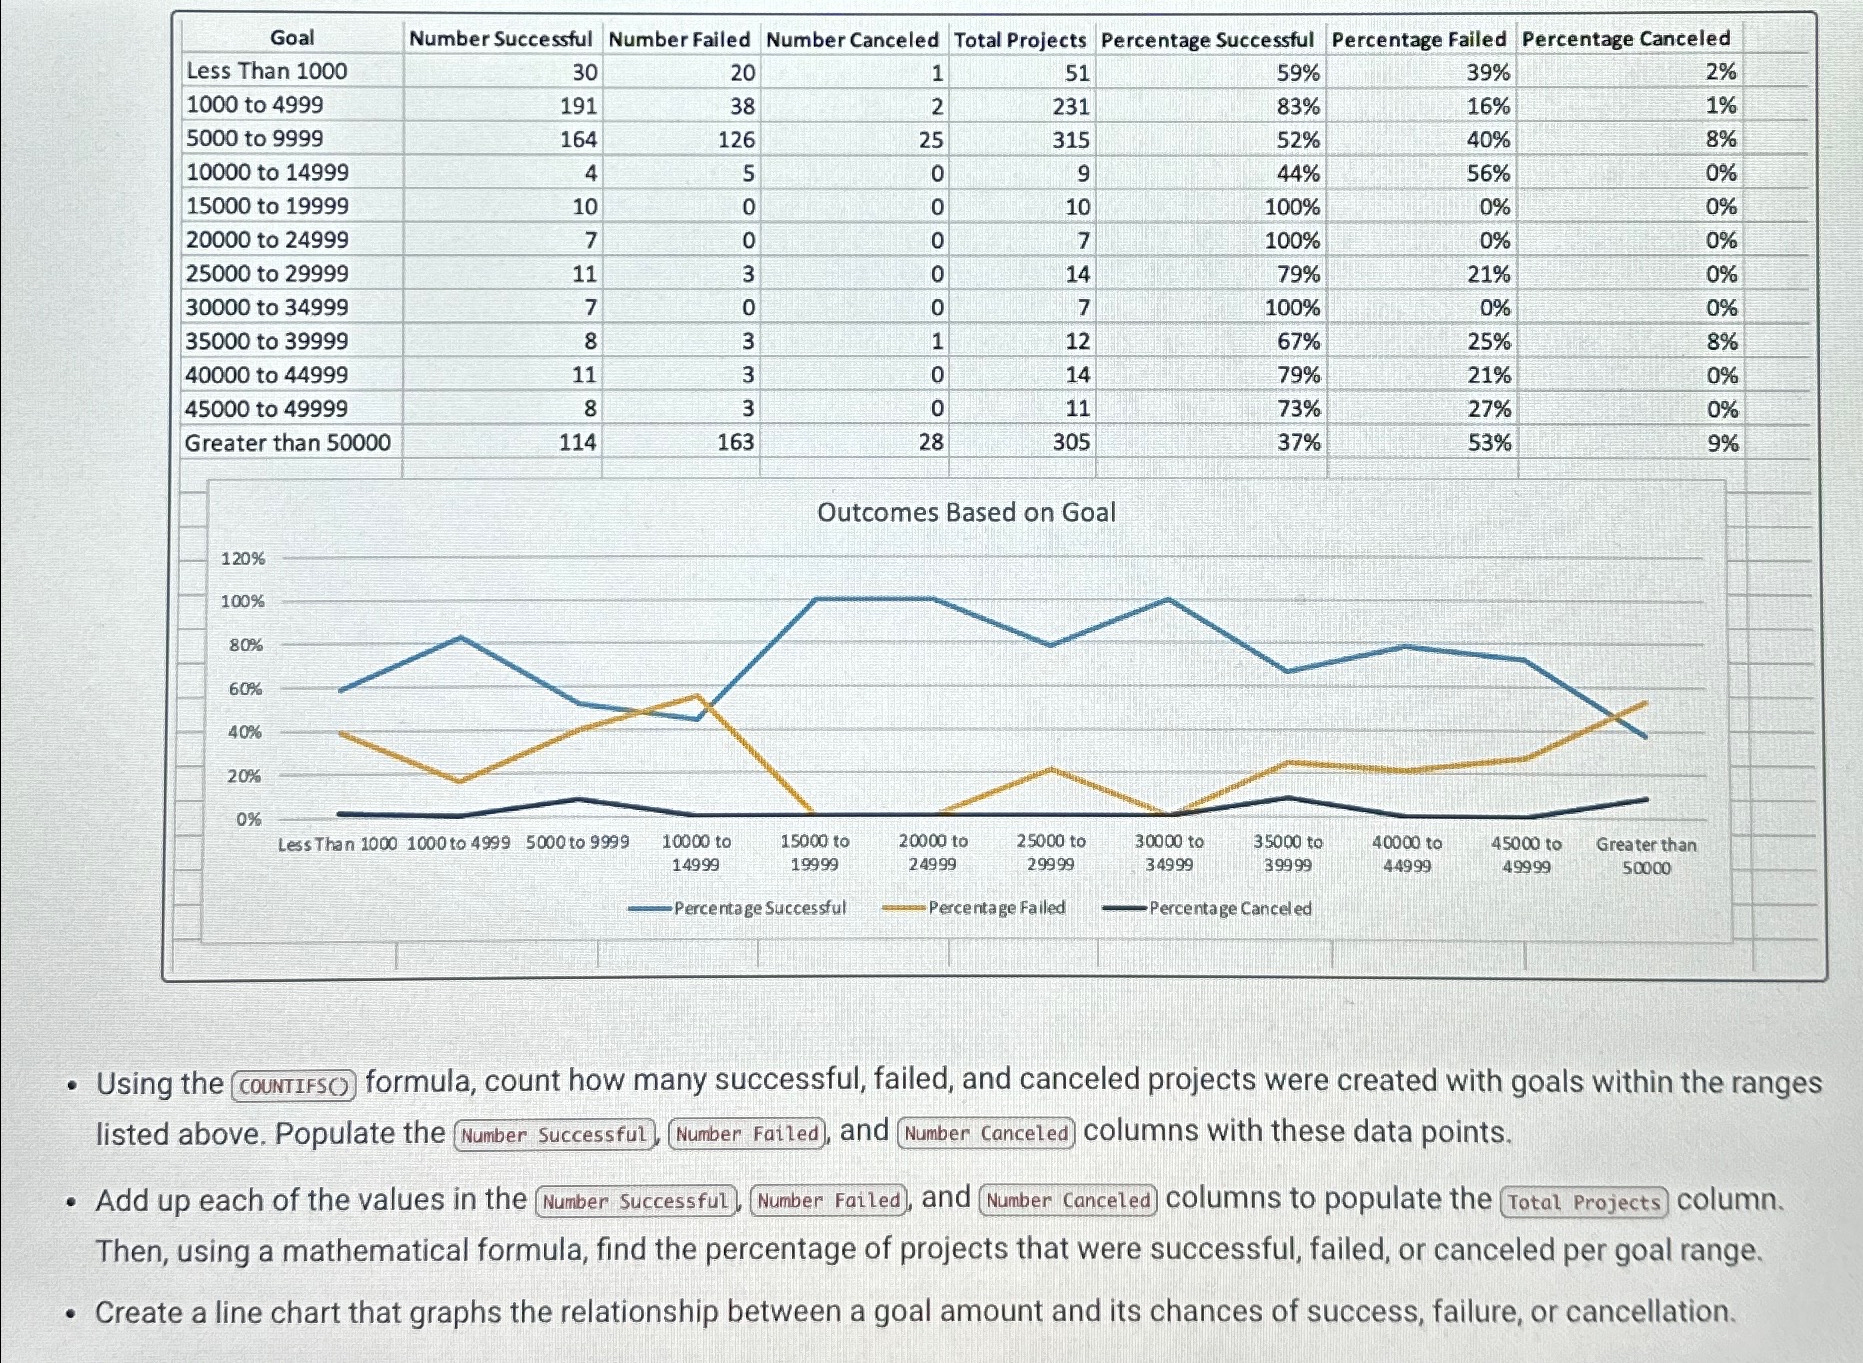
Using the formula, count how many successful, failed, and canceled projects were created with goals within the ranges listed above. Populate the Number Failed, and columns with these data points.
Add up each of the values in the Number Successful, Number Failed, and columns to populate the Total Projects column. Then, using a mathematical formula, find the percentage of projects that were successful, failed, or canceled per goal range.
Create a line chart that graphs the relationship between a goal amount and its chances of success, failure, or cancellation.
What numbers I use calculate the percentages? Where I grab that data from?

Step by Step Solution
There are 3 Steps involved in it
Step: 1

Get Instant Access to Expert-Tailored Solutions
See step-by-step solutions with expert insights and AI powered tools for academic success
Step: 2

Step: 3

Ace Your Homework with AI
Get the answers you need in no time with our AI-driven, step-by-step assistance
Get Started


