

Answered step by step
Verified Expert Solution
Question
1 Approved Answer
Using the given data please provide the information for the writing module. Provide: Period with explanation of how you determined the value. Amplitude with explanation
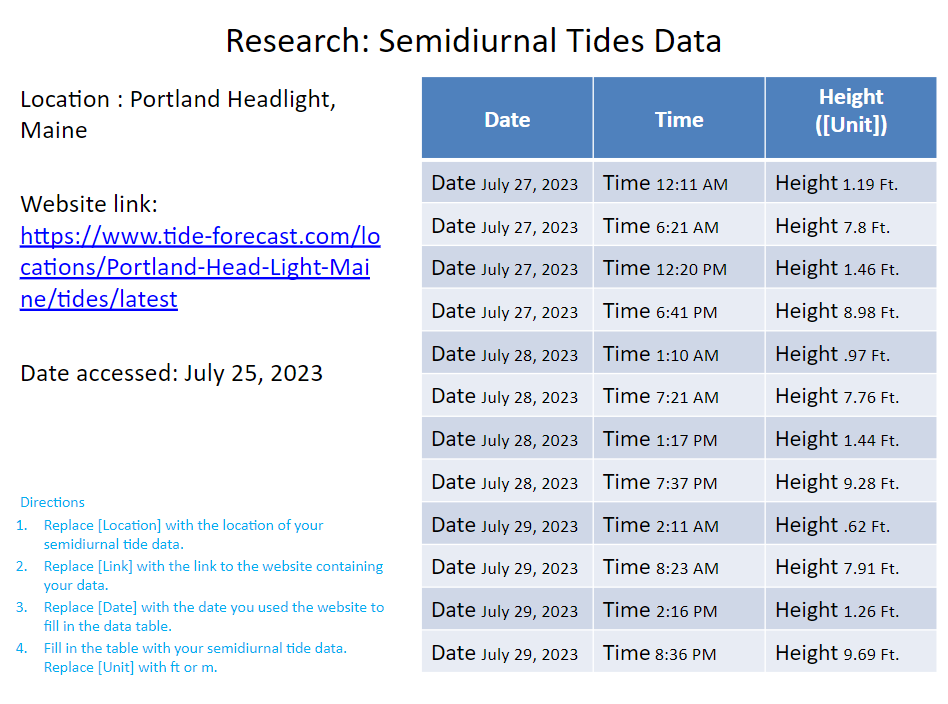
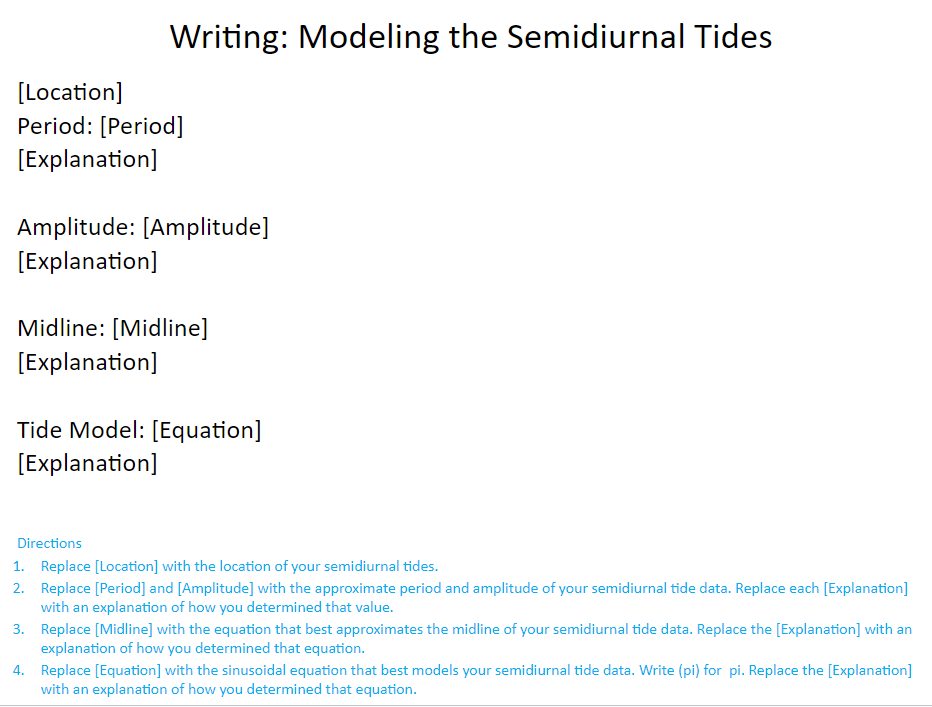
Using the given data please provide the information for the writing module.
Provide:
- Period with explanation of how you determined the value.
- Amplitude with explanation of how you determined the value.
- Midline with explanation of how you determined the value.
- Tide model with explanation of how you determined the value.
- Graph that shows the 12 semidiurnal Tides and the graph of the equation that best models those 12 semidiurnal Tides.
Step by Step Solution
There are 3 Steps involved in it
Step: 1

Get Instant Access to Expert-Tailored Solutions
See step-by-step solutions with expert insights and AI powered tools for academic success
Step: 2

Step: 3
Ace Your Homework with AI
Get the answers you need in no time with our AI-driven, step-by-step assistance
Get Started
Quantitative Analysis For Management
Authors: Barry Render, Ralph M. Stair, Michael E. Hanna
11th Edition
9780132997621, 132149117, 132997622, 978-0132149112