Question
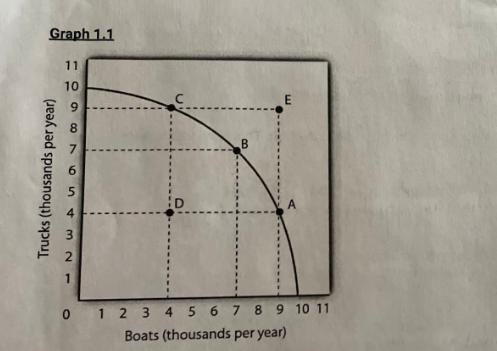
Using the graph above, answer the following questions. 16. How many boats could this company produce if they did not produce any trucks? 17.


Using the graph above, answer the following questions. 16. How many boats could this company produce if they did not produce any trucks? 17. Which point on the graph would represent underutilization of the companies' resources? 18. If this company chose to produce 9,000 trucks per year, how many boats could they produce? Graph 1.1 Trucks (thousands per year) 11 10 9 7654321 D B E 0 1 2 3 4 5 6 7 8 9 10 11 Boats (thousands per year)
Step by Step Solution
3.48 Rating (148 Votes )
There are 3 Steps involved in it
Step: 1
16 How many boats could this company produce if they did not produce any trucks Looking at the graph ...
Get Instant Access to Expert-Tailored Solutions
See step-by-step solutions with expert insights and AI powered tools for academic success
Step: 2

Step: 3

Ace Your Homework with AI
Get the answers you need in no time with our AI-driven, step-by-step assistance
Get StartedRecommended Textbook for
Project Management The Managerial Process
Authors: Eric W Larson, Clifford F. Gray
8th Edition
1260570436, 978-1260570434
Students also viewed these Economics questions
Question
Answered: 1 week ago
Question
Answered: 1 week ago
Question
Answered: 1 week ago
Question
Answered: 1 week ago
Question
Answered: 1 week ago
Question
Answered: 1 week ago
Question
Answered: 1 week ago
Question
Answered: 1 week ago
Question
Answered: 1 week ago
Question
Answered: 1 week ago
Question
Answered: 1 week ago
Question
Answered: 1 week ago
Question
Answered: 1 week ago
Question
Answered: 1 week ago
Question
Answered: 1 week ago
Question
Answered: 1 week ago
Question
Answered: 1 week ago
Question
Answered: 1 week ago
Question
Answered: 1 week ago
Question
Answered: 1 week ago
Question
Answered: 1 week ago
Question
Answered: 1 week ago
View Answer in SolutionInn App


