

Answered step by step
Verified Expert Solution
Question
1 Approved Answer
Using the graph, shift the short-run aggregate supply (AS) curve or the aggregate demand (AD) curve to show the short-run impact of the increase

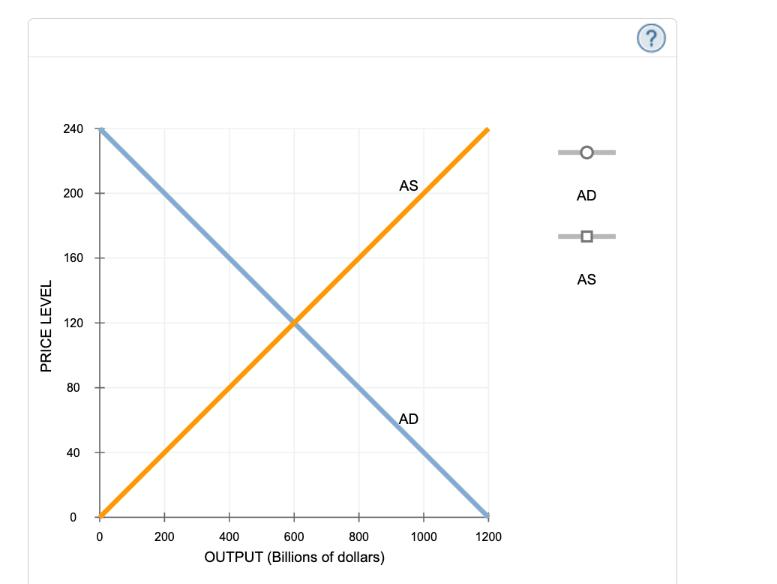
Using the graph, shift the short-run aggregate supply (AS) curve or the aggregate demand (AD) curve to show the short-run impact of the increase in government spending. PRICE LEVEL 240 200 160 120 80 40 0 0 200 400 600 800 OUTPUT (Billions of dollars) AS AD 1000 1200 AD 0 AS (?)
Step by Step Solution
There are 3 Steps involved in it
Step: 1
From the Image attached below it can be observed that in the short ...
Get Instant Access to Expert-Tailored Solutions
See step-by-step solutions with expert insights and AI powered tools for academic success
Step: 2

Step: 3
Ace Your Homework with AI
Get the answers you need in no time with our AI-driven, step-by-step assistance
Get Started
Principles Of Macroeconomics
Authors: Karl E. Case,Ray C. Fair , Sharon E. Oster
13th Global Edition
1292303824, 978-1292303826