Answered step by step
Verified Expert Solution
Link Copied!

Question

1 Approved Answer

Using the historical financial statements for Allen Interiors, forecast the June 30, 2019 Income Statement and Balance Sheet. Use the percent of Sales method and

Using the historical financial statements for Allen Interiors, forecast the June 30, 2019 Income Statement and Balance Sheet.
Use the percent of Sales method and the following assumptions:
(1) Sales in FY 2019 will be $761.20.
(2) Tax rate will be 25%.
(3) Each item that changes with sales will be the five-year average percentage of sales.
(4) Gross Property, Plant & Equipment will increase to $675.
(5) Addition to Gross PP&E will follow a straight-line depreciation (20 years with no salvage value).
(6) Dividends in 2019 will be $0.80 per share.
(7) Interest rate on all debt (short-term and long-term) is 4.0%.
(8) Use Long-Term Debt as your plug-in figure in the Balance Sheet (please use 4 decimal places to show your answer).
Use your judgement on other items.
A. In cell H77 calculate the difference in Long-Term Debt between 2018 and 2019.
B. Interpret the amoimage text in transcribed
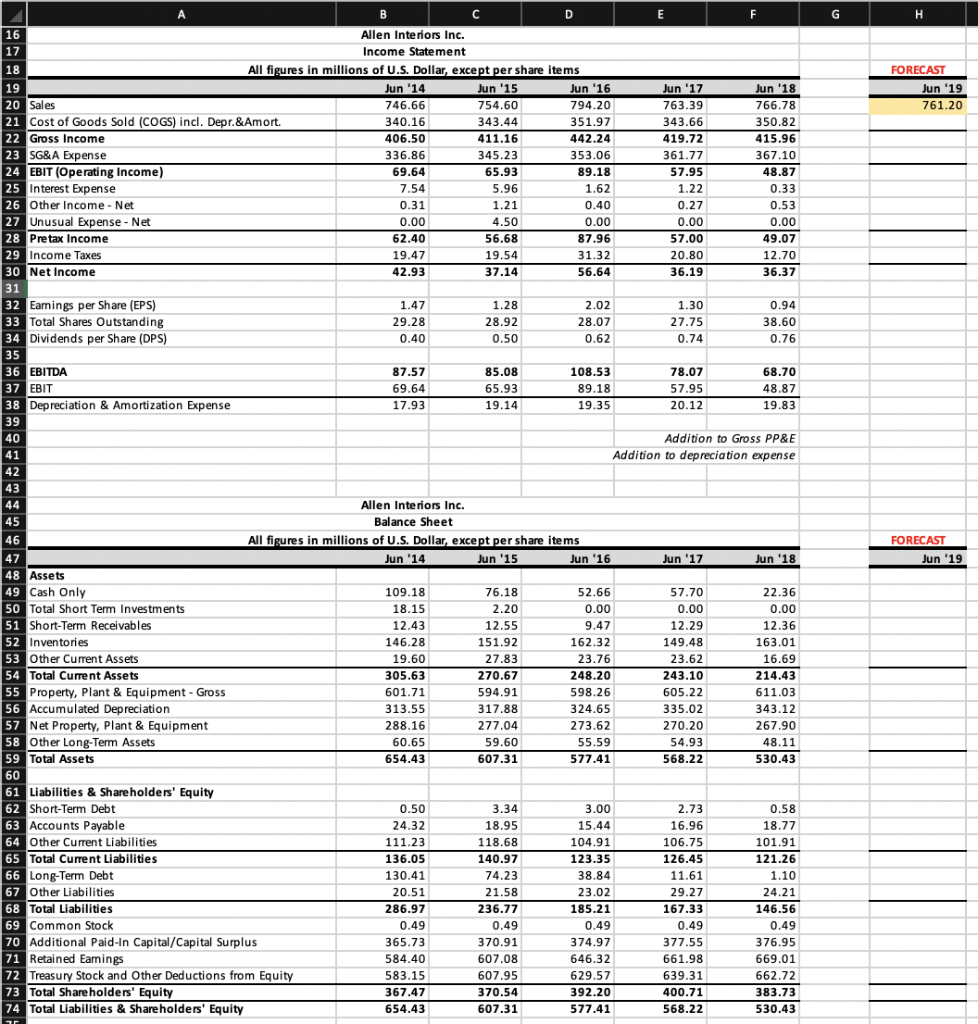
unt in A above. Why are these funds needed or not needed in 2019?
G H Jun '14 FORECAST Jun '19 761.20 A B D E F 16 Allen Interiors Inc. 17 Income Statement 18 All figures in millions of U.S. Dollar, except per share items 19 Jun '15 Jun '16 Jun '17 Jun '18 20 Sales 746.66 754.60 794.20 763.39 766.78 21 Cost of Goods Sold (COGS) incl. Depr.&Amort. 340.16 343.44 351.97 343.66 350.82 22 Gross Income 406.50 411.16 442.24 419.72 415.96 23 SG&A Expense 336.86 345.23 353.06 361.77 367.10 24 EBIT (Operating Income) 69.64 65.93 89.18 57.95 48.87 25 Interest Expense 7.54 5.96 1.62 1.22 0.33 26 Other Income - Net 0.31 1.21 0.40 0.27 0.53 27 Unusual Expense - Net 0.00 4.50 0.00 0.00 0.00 28 Pretax Income 62.40 56.68 87.96 57.00 49.07 29 Income Taxes 19.47 19.54 31.32 20.80 12.70 30 Net Income 42.93 37.14 56.64 36.19 36.37 31 32 Earnings per Share (EPS) 1.47 1.28 2.02 1.30 0.94 33 Total Shares Outstanding 29.28 28.92 28.07 27.75 38.60 34 Dividends per Share (DPS) 0.40 0.50 0.62 0.74 0.76 35 36 EBITDA 87.57 85.08 108.53 78.07 68.70 37 EBIT 69.64 65.93 89.18 57.95 48.87 38 Depreciation & Amortization Expense 17.93 19.14 19.35 20.12 19.83 39 40 Addition to Gross PP&E 41 Addition to depreciation expense 42 43 44 Allen Interiors Inc. 45 Balance Sheet 46 All figures in millions of U.S. Dollar, except per share items 47 Jun '14 Jun '15 Jun '16 Jun '17 Jun '18 48 Assets 49 Cash Only 109.18 76.18 52.66 57.70 22.36 50 Total Short Term Investments 18.15 2.20 0.00 0.00 0.00 51 Short-Term Receivables 12.43 12.55 9.47 12.29 12.36 52 Inventories 146.28 151.92 162.32 149.48 163.01 53 Other Current Assets 19.60 27.83 23.76 23.62 16.69 54 Total Current Assets 305.63 270.67 248.20 243.10 214.43 55 Property, Plant & Equipment - Gross 601.71 594.91 598.26 605.22 611.03 56 Accumulated Depreciation 313.55 317.88 324.65 335.02 343.12 57 Net Property, Plant & Equipment 288.16 277.04 273.62 270.20 267.90 58 Other Long-Term Assets 60.65 59.60 55.59 54.93 48.11 59 Total Assets 654.43 607.31 577.41 568.22 530.43 60 61 Liabilities & Shareholders' Equity 62 Short-Term Debt 0.50 3.34 3.00 2.73 0.58 63 Accounts Payable 24.32 18.95 15.44 16.96 18.77 64 Other Current Liabilities 111.23 118.68 104.91 106.75 101.91 65 Total Current Liabilities 136.05 140.97 123.35 126.45 121.26 66 Long-Term Debt 130.41 74.23 38.84 11.61 1.10 67 Other Liabilities 20.51 21.58 23.02 29.27 24.21 68 Total Liabilities de wa 286.97 236.77 185.21 167.33 146.56 69 Common Stock 0.49 0.49 0.49 0.49 0.49 70 Additional Paid-In Capital/Capital Surplus 365.73 370.91 374.97 377.55 376.95 71 Retained Eamings 584.40 607.08 646.32 661.98 669.01 72 Treasury Stock and Other Deductions from Equity 583.15 607.95 629.57 639.31 662.72 73 Total Shareholders' Equity 367.47 370.54 392.20 400.71 383.73 74 Total Liabilities & Shareholders' Equity 654.43 607.31 577.41 568.22 530.43 FORECAST Jun '19 F G H Jun '14 FORECAST Jun '19 761.20 A B D E F 16 Allen Interiors Inc. 17 Income Statement 18 All figures in millions of U.S. Dollar, except per share items 19 Jun '15 Jun '16 Jun '17 Jun '18 20 Sales 746.66 754.60 794.20 763.39 766.78 21 Cost of Goods Sold (COGS) incl. Depr.&Amort. 340.16 343.44 351.97 343.66 350.82 22 Gross Income 406.50 411.16 442.24 419.72 415.96 23 SG&A Expense 336.86 345.23 353.06 361.77 367.10 24 EBIT (Operating Income) 69.64 65.93 89.18 57.95 48.87 25 Interest Expense 7.54 5.96 1.62 1.22 0.33 26 Other Income - Net 0.31 1.21 0.40 0.27 0.53 27 Unusual Expense - Net 0.00 4.50 0.00 0.00 0.00 28 Pretax Income 62.40 56.68 87.96 57.00 49.07 29 Income Taxes 19.47 19.54 31.32 20.80 12.70 30 Net Income 42.93 37.14 56.64 36.19 36.37 31 32 Earnings per Share (EPS) 1.47 1.28 2.02 1.30 0.94 33 Total Shares Outstanding 29.28 28.92 28.07 27.75 38.60 34 Dividends per Share (DPS) 0.40 0.50 0.62 0.74 0.76 35 36 EBITDA 87.57 85.08 108.53 78.07 68.70 37 EBIT 69.64 65.93 89.18 57.95 48.87 38 Depreciation & Amortization Expense 17.93 19.14 19.35 20.12 19.83 39 40 Addition to Gross PP&E 41 Addition to depreciation expense 42 43 44 Allen Interiors Inc. 45 Balance Sheet 46 All figures in millions of U.S. Dollar, except per share items 47 Jun '14 Jun '15 Jun '16 Jun '17 Jun '18 48 Assets 49 Cash Only 109.18 76.18 52.66 57.70 22.36 50 Total Short Term Investments 18.15 2.20 0.00 0.00 0.00 51 Short-Term Receivables 12.43 12.55 9.47 12.29 12.36 52 Inventories 146.28 151.92 162.32 149.48 163.01 53 Other Current Assets 19.60 27.83 23.76 23.62 16.69 54 Total Current Assets 305.63 270.67 248.20 243.10 214.43 55 Property, Plant & Equipment - Gross 601.71 594.91 598.26 605.22 611.03 56 Accumulated Depreciation 313.55 317.88 324.65 335.02 343.12 57 Net Property, Plant & Equipment 288.16 277.04 273.62 270.20 267.90 58 Other Long-Term Assets 60.65 59.60 55.59 54.93 48.11 59 Total Assets 654.43 607.31 577.41 568.22 530.43 60 61 Liabilities & Shareholders' Equity 62 Short-Term Debt 0.50 3.34 3.00 2.73 0.58 63 Accounts Payable 24.32 18.95 15.44 16.96 18.77 64 Other Current Liabilities 111.23 118.68 104.91 106.75 101.91 65 Total Current Liabilities 136.05 140.97 123.35 126.45 121.26 66 Long-Term Debt 130.41 74.23 38.84 11.61 1.10 67 Other Liabilities 20.51 21.58 23.02 29.27 24.21 68 Total Liabilities de wa 286.97 236.77 185.21 167.33 146.56 69 Common Stock 0.49 0.49 0.49 0.49 0.49 70 Additional Paid-In Capital/Capital Surplus 365.73 370.91 374.97 377.55 376.95 71 Retained Eamings 584.40 607.08 646.32 661.98 669.01 72 Treasury Stock and Other Deductions from Equity 583.15 607.95 629.57 639.31 662.72 73 Total Shareholders' Equity 367.47 370.54 392.20 400.71 383.73 74 Total Liabilities & Shareholders' Equity 654.43 607.31 577.41 568.22 530.43 FORECAST Jun '19 F

Step by Step Solution

There are 3 Steps involved in it

Step: 1

blur-text-image

Get Instant Access to Expert-Tailored Solutions

See step-by-step solutions with expert insights and AI powered tools for academic success

Step: 2

blur-text-image

Step: 3

blur-text-image

Ace Your Homework with AI

Get the answers you need in no time with our AI-driven, step-by-step assistance

Get Started

Recommended Textbook for

Financial Accounting

Authors: Jerry J. Weygandt, Donald E. Kieso, Paul D. Kimmel

8th edition

978-1118953907, 9781118953808, 1118953908, 1118953800, 978-1119491057

More Books

Students also viewed these Accounting questions

Question

Can I rule out confounding factors? (163)

Answered: 1 week ago