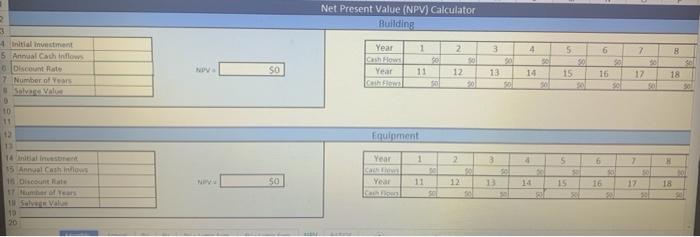
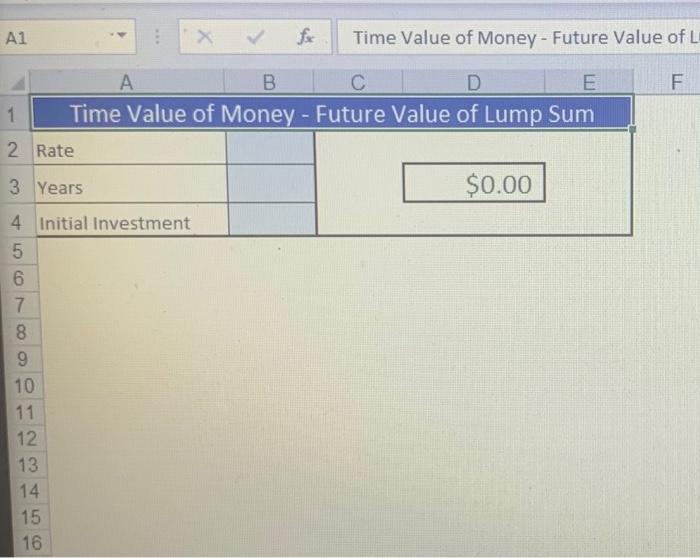
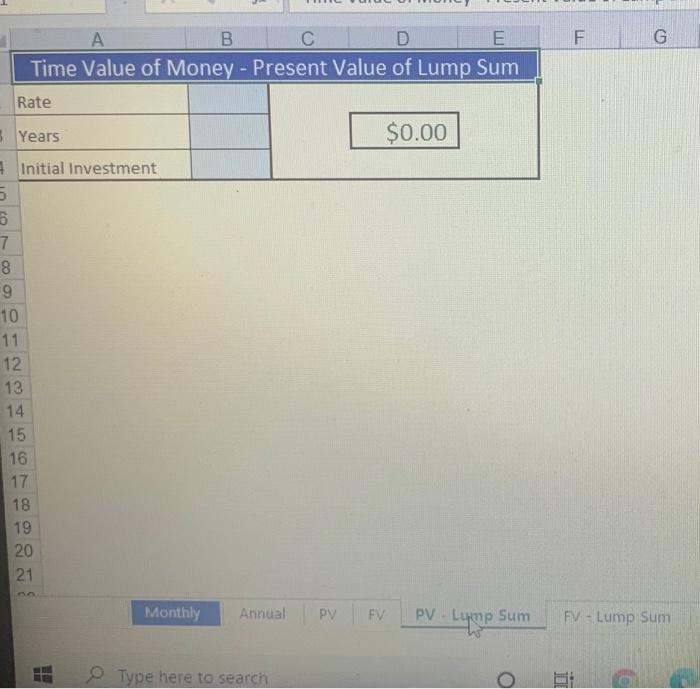
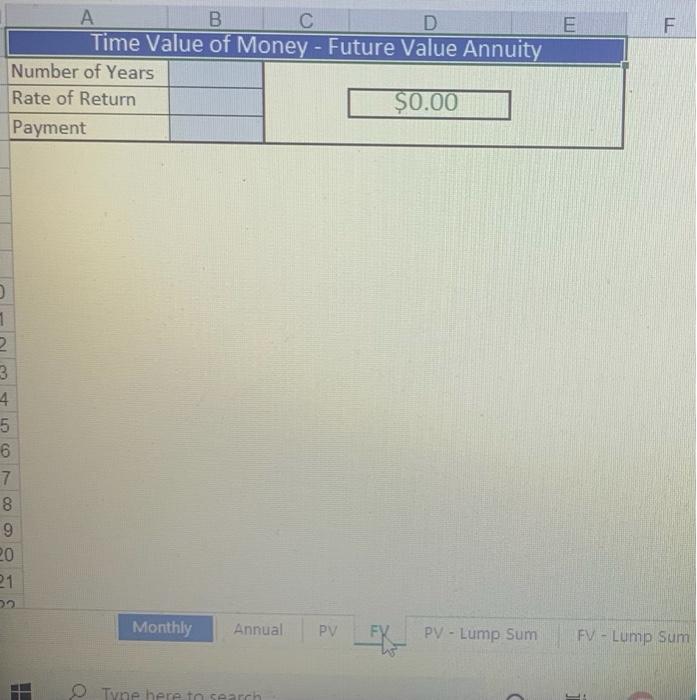
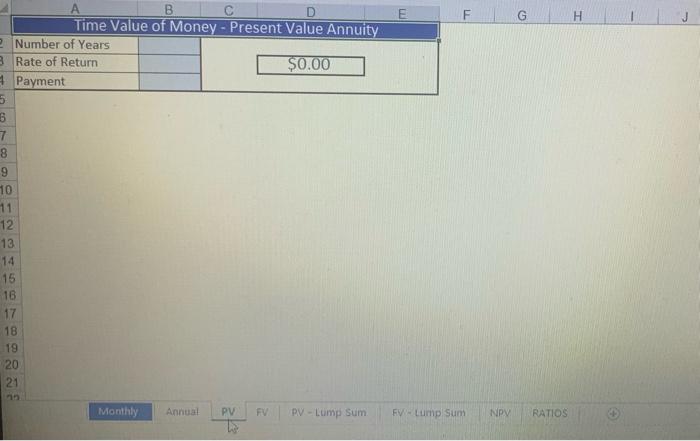
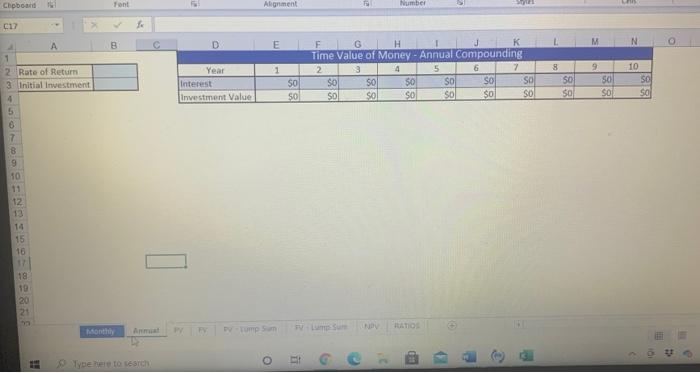
using the imcome statement, balance sheet, and cash flow statements where do i find total debts & stock price? also, im not sure where to begin with the excel charts below. any help would be appreciated.
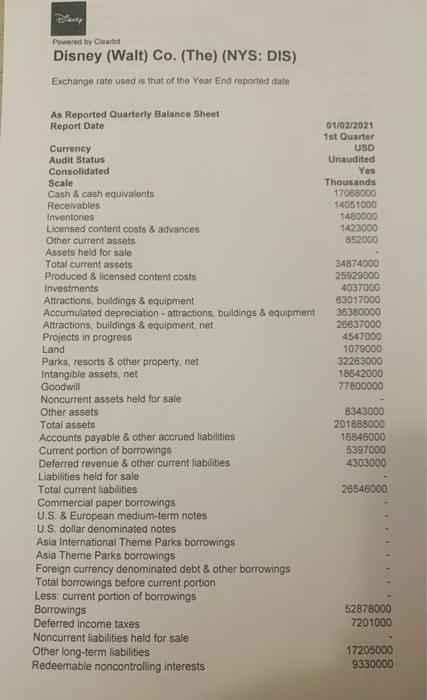
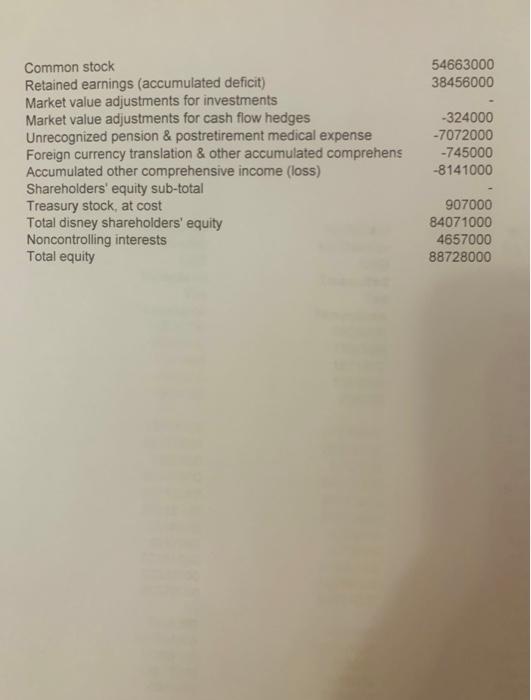
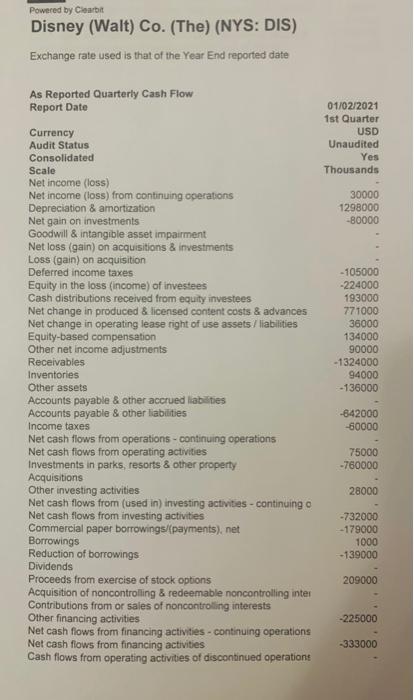
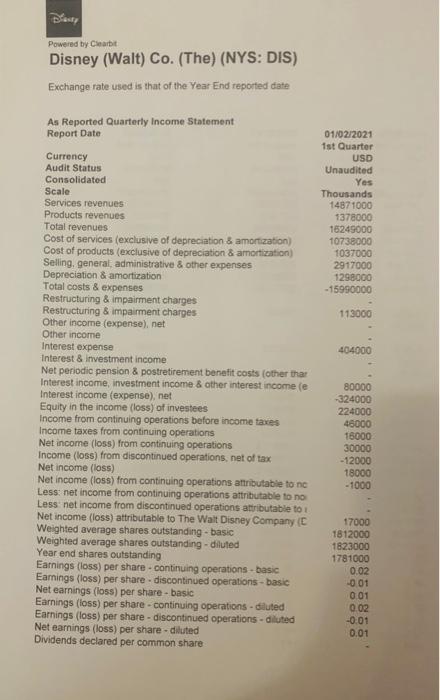
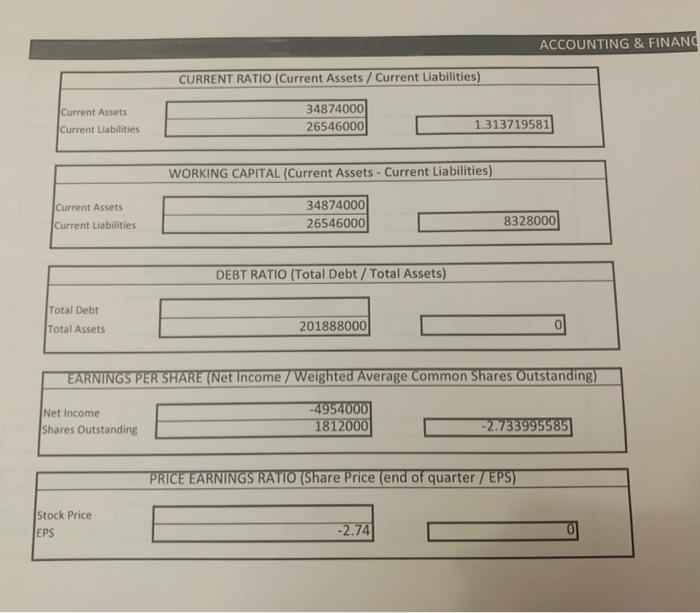
Powered by Clear Disney (Walt) Co. (The) (NYS: DIS) Exchange rate used is that of the Year End reported date 01/02/2021 1st Quarter USD Unaudited Yes Thousands 17068000 14051000 1480000 1423000 852000 As Reported Quarterly Balance Sheet Report Date Currency Audit Status Consolidated Scale Cash & cash equivalents Receivables Inventories Licensed content costs & advances Other current assets Assets held for sale Total current assets Produced & licensed content costs Investments Attractions, buildings & equipment Accumulated depreciation - attractions, buildings & equipment Attractions, buildings & equipment, net Projects in progress Land Parks, resorts & other property, net Intangible assets, net Goodwill Noncurrent assets held for sale Other assets Total assets Accounts payable & other accrued liabilities Current portion of borrowings Deferred revenue & other current liabilities Liabilities held for sale Total current liabilities Commercial paper borrowings U.S. & European medium-term notes U.S. dollar denominated notes Asia International Theme Parks borrowings Asia Theme Parks borrowings Foreign currency denominated debt & other borrowings Total borrowings before current portion Less: current portion of borrowings Borrowings Deferred income taxes Noncurrent liabilities held for sale Other long-term liabilities Redeemable noncontrolling interests 34874000 25929000 4037000 63017000 36380000 26637000 4547000 1079000 32263000 18842000 77800000 8343000 201888000 16846000 5397000 4303000 26546000 52878000 7201000 17205000 9330000 54663000 38456000 Common stock Retained earnings (accumulated deficit) Market value adjustments for investments Market value adjustments for cash flow hedges Unrecognized pension & postretirement medical expense Foreign currency translation & other accumulated comprehens Accumulated other comprehensive income (loss) Shareholders' equity sub-total Treasury stock, at cost Total disney shareholders' equity Noncontrolling interests Total equity -324000 -7072000 -745000 -8141000 907000 84071000 4657000 88728000 Powered by Clarbit Disney (Walt) Co. (The) (NYS: DIS) Exchange rate used is that of the Year End reported date 01/02/2021 1st Quarter USD Unaudited Yes Thousands 30000 1298000 -80000 As Reported Quarterly Cash Flow Report Date Currency Audit Status Consolidated Scale Net income (loss) Net income (loss) from continuing operations Depreciation & amortization Net gain on investments Goodwill & intangible asset impairment Net loss (gain) on acquisitions & investments Loss (gain) on acquisition Deferred income taxes Equity in the loss (income) of investees Cash distributions received from equity investees Net change in produced & licensed content costs & advances Net change in operating lease right of use assets / liabilities Equity-based compensation Other net income adjustments Receivables Inventories Other assets Accounts payable & other accrued liabilities Accounts payable & other liabilities Income taxes Net cash flows from operations - continuing operations Net cash flows from operating activities Investments in parks, resorts & other property Acquisitions Other investing activities Net cash flows from (used in) investing activities - continuing o Net cash flows from investing activities Commercial paper borrowings/(payments), net Borrowings Reduction of borrowings Dividends Proceeds from exercise of stock options Acquisition of noncontrolling & redeemable noncontrolling inter Contributions from or sales of noncontrolling interests Other financing activities Net cash flows from financing activities - continuing operations Net cash flows from financing activities Cash flows from operating activities of discontinued operations - 105000 -224000 193000 771000 36000 134000 90000 -1324000 94000 -136000 -642000 -60000 75000 -760000 28000 -732000 -179000 1000 - 139000 209000 -225000 -333000 Powered by Chart Disney (Walt) Co. (The) (NYS: DIS) Exchange rate used is that of the Year End reported date 01/02/2021 1st Quarter USD Unaudited Yes Thousands 14871000 1378000 15249000 10738000 1037000 2917000 1298000 - 15990000 113000 404000 As Reported Quarterly Income Statement Report Date Currency Audit Status Consolidated Scale Services revenues Products revenues Total revenues Cost of services (exclusive of depreciation & amortization) Cost of products (exclusive of depreciation & amortization) Selling, general, administrative & other expenses Depreciation & amortization Total costs & expenses Restructuring & Impairment charges Restructuring & impairment charges Other income (expense), net Other income Interest expense Interest & Investment income Net periodic pension & postretirement benefit costs (other thar Interest income, investment income & other interest income (e Interest income (expense), net Equity in the income (loss) of investees Income from continuing operations before income taxes Income taxes from continuing operations Net income (loss) from continuing operations Income (loss) from discontinued operations, net of tax Net income (loss) Net income (loss) from continuing operations attributable to ne Less: net income from continuing operations attributable to no Less net income from discontinued operations attributable to Net income (loss) attributable to The Walt Disney Company (C Weighted average shares outstanding - basic Weighted average shares outstanding - diluted Year end shares outstanding Earnings (loss) per share continuing operations - basic Earnings (loss) per share. discontinued operations - basic Net earnings (loss) per share-basic Earnings (loss) per share - continuing operations -diluted Earnings (loss) per share - discontinued operations - diluted Net earnings (loss) per share-diluted Dividends declared per common share 80000 -324000 224000 48000 16000 30000 - 12000 18000 -1000 17000 1812000 1823000 1781000 0.02 -0.01 001 0.02 -0.01 0.01 ACCOUNTING & FINANC CURRENT RATIO (Current Assets / Current Liabilities) Current Assets Current Liabilities 34874000 26546000 1.313719581 WORKING CAPITAL (Current Assets - Current Liabilities) Current Assets Current Liabilities 34874000 26546000 8328000 DEBT RATIO (Total Debt / Total Assets) Total Debt Total Assets 201888000 0 EARNINGS PER SHARE (Net Income / Weighted Average Common Shares Outstanding) Net Income shares Outstanding -4954000 1812000 -2.733995585 PRICE EARNINGS RATIO (Share Price (end of quarter / EPS) Stock Price EPS -2.74 Net Present Value (NPV) Calculator Building Year 1 2 3 4 7 B 3 Initial incent 5 Anna Cathinos Discount 7 Number of Salvar sol 5 SA 15 SO Year 11 6 So 16 so 12 13 14 17 18 10 10 Equipment 1 Year 1 2 3 5 6 7 15 Anal Cath Olicount Rate so NEVA $0 Year 11 12 1 15 16 17 18 Saham 10 A1 : X f Time Value of Money - Future Value of L F 6 A B D E 1 Time Value of Money - Future Value of Lump Sum 2 Rate 3 Years $0.00 4 Initial Investment 5 6 7 8 9 10 11 12 13 14 15 16 F G A D E Time Value of Money - Present Value of Lump Sum Rate 3 Years $0.00 Initial Investment 6 6 7 8 9 10 11 12 13 14 15 16 17 5 18 19 20 21 Monthly Annual PV | FV PV-lymp Sum FV - Lump sum Type here to search F G A D E Time Value of Money - Present Value of Lump Sum Rate 3 Years $0.00 Initial Investment 6 6 7 8 9 10 11 12 13 14 15 16 17 5 18 19 20 21 Monthly Annual PV | FV PV-lymp Sum FV - Lump sum Type here to search E F B D Time Value of Money - Future Value Annuity Number of Years Rate of Return $0.00 Payment 1 2. 3 4 5 6 7 8 9 20 21 Monthly Annual PV PV - Lump Sum FV - Lump Sum Tyne here to search F G H Time Value of Money - Present Value Annuity Number of Years 3 Rate of Return $0.00 Payment 5 7 8 9 10 11 12 13 14 15 16 17 18 19 20 21 Monthly Annual PV F PV - Cump Sum FV-lump Sum NPY RATIOS Chpboard Tont Alignment Number C17 D E M N 1 8 4 G H Time Value of Money - Annual Compounding 2 3 5 6 7 SO SO 50 SO SO SO sol sol SO Sol $0 SO Year Interest Investment Value SO $0 so $0 9 so sol 10 so 50 A 1 2 Rate of Return 3 Initial Investment 4 5 6 7 B 9 10 11 12 13 14 15 16 17 18 19 20 21 - Dv-tump sam 3 Type here to search Powered by Clear Disney (Walt) Co. (The) (NYS: DIS) Exchange rate used is that of the Year End reported date 01/02/2021 1st Quarter USD Unaudited Yes Thousands 17068000 14051000 1480000 1423000 852000 As Reported Quarterly Balance Sheet Report Date Currency Audit Status Consolidated Scale Cash & cash equivalents Receivables Inventories Licensed content costs & advances Other current assets Assets held for sale Total current assets Produced & licensed content costs Investments Attractions, buildings & equipment Accumulated depreciation - attractions, buildings & equipment Attractions, buildings & equipment, net Projects in progress Land Parks, resorts & other property, net Intangible assets, net Goodwill Noncurrent assets held for sale Other assets Total assets Accounts payable & other accrued liabilities Current portion of borrowings Deferred revenue & other current liabilities Liabilities held for sale Total current liabilities Commercial paper borrowings U.S. & European medium-term notes U.S. dollar denominated notes Asia International Theme Parks borrowings Asia Theme Parks borrowings Foreign currency denominated debt & other borrowings Total borrowings before current portion Less: current portion of borrowings Borrowings Deferred income taxes Noncurrent liabilities held for sale Other long-term liabilities Redeemable noncontrolling interests 34874000 25929000 4037000 63017000 36380000 26637000 4547000 1079000 32263000 18842000 77800000 8343000 201888000 16846000 5397000 4303000 26546000 52878000 7201000 17205000 9330000 54663000 38456000 Common stock Retained earnings (accumulated deficit) Market value adjustments for investments Market value adjustments for cash flow hedges Unrecognized pension & postretirement medical expense Foreign currency translation & other accumulated comprehens Accumulated other comprehensive income (loss) Shareholders' equity sub-total Treasury stock, at cost Total disney shareholders' equity Noncontrolling interests Total equity -324000 -7072000 -745000 -8141000 907000 84071000 4657000 88728000 Powered by Clarbit Disney (Walt) Co. (The) (NYS: DIS) Exchange rate used is that of the Year End reported date 01/02/2021 1st Quarter USD Unaudited Yes Thousands 30000 1298000 -80000 As Reported Quarterly Cash Flow Report Date Currency Audit Status Consolidated Scale Net income (loss) Net income (loss) from continuing operations Depreciation & amortization Net gain on investments Goodwill & intangible asset impairment Net loss (gain) on acquisitions & investments Loss (gain) on acquisition Deferred income taxes Equity in the loss (income) of investees Cash distributions received from equity investees Net change in produced & licensed content costs & advances Net change in operating lease right of use assets / liabilities Equity-based compensation Other net income adjustments Receivables Inventories Other assets Accounts payable & other accrued liabilities Accounts payable & other liabilities Income taxes Net cash flows from operations - continuing operations Net cash flows from operating activities Investments in parks, resorts & other property Acquisitions Other investing activities Net cash flows from (used in) investing activities - continuing o Net cash flows from investing activities Commercial paper borrowings/(payments), net Borrowings Reduction of borrowings Dividends Proceeds from exercise of stock options Acquisition of noncontrolling & redeemable noncontrolling inter Contributions from or sales of noncontrolling interests Other financing activities Net cash flows from financing activities - continuing operations Net cash flows from financing activities Cash flows from operating activities of discontinued operations - 105000 -224000 193000 771000 36000 134000 90000 -1324000 94000 -136000 -642000 -60000 75000 -760000 28000 -732000 -179000 1000 - 139000 209000 -225000 -333000 Powered by Chart Disney (Walt) Co. (The) (NYS: DIS) Exchange rate used is that of the Year End reported date 01/02/2021 1st Quarter USD Unaudited Yes Thousands 14871000 1378000 15249000 10738000 1037000 2917000 1298000 - 15990000 113000 404000 As Reported Quarterly Income Statement Report Date Currency Audit Status Consolidated Scale Services revenues Products revenues Total revenues Cost of services (exclusive of depreciation & amortization) Cost of products (exclusive of depreciation & amortization) Selling, general, administrative & other expenses Depreciation & amortization Total costs & expenses Restructuring & Impairment charges Restructuring & impairment charges Other income (expense), net Other income Interest expense Interest & Investment income Net periodic pension & postretirement benefit costs (other thar Interest income, investment income & other interest income (e Interest income (expense), net Equity in the income (loss) of investees Income from continuing operations before income taxes Income taxes from continuing operations Net income (loss) from continuing operations Income (loss) from discontinued operations, net of tax Net income (loss) Net income (loss) from continuing operations attributable to ne Less: net income from continuing operations attributable to no Less net income from discontinued operations attributable to Net income (loss) attributable to The Walt Disney Company (C Weighted average shares outstanding - basic Weighted average shares outstanding - diluted Year end shares outstanding Earnings (loss) per share continuing operations - basic Earnings (loss) per share. discontinued operations - basic Net earnings (loss) per share-basic Earnings (loss) per share - continuing operations -diluted Earnings (loss) per share - discontinued operations - diluted Net earnings (loss) per share-diluted Dividends declared per common share 80000 -324000 224000 48000 16000 30000 - 12000 18000 -1000 17000 1812000 1823000 1781000 0.02 -0.01 001 0.02 -0.01 0.01 ACCOUNTING & FINANC CURRENT RATIO (Current Assets / Current Liabilities) Current Assets Current Liabilities 34874000 26546000 1.313719581 WORKING CAPITAL (Current Assets - Current Liabilities) Current Assets Current Liabilities 34874000 26546000 8328000 DEBT RATIO (Total Debt / Total Assets) Total Debt Total Assets 201888000 0 EARNINGS PER SHARE (Net Income / Weighted Average Common Shares Outstanding) Net Income shares Outstanding -4954000 1812000 -2.733995585 PRICE EARNINGS RATIO (Share Price (end of quarter / EPS) Stock Price EPS -2.74 Net Present Value (NPV) Calculator Building Year 1 2 3 4 7 B 3 Initial incent 5 Anna Cathinos Discount 7 Number of Salvar sol 5 SA 15 SO Year 11 6 So 16 so 12 13 14 17 18 10 10 Equipment 1 Year 1 2 3 5 6 7 15 Anal Cath Olicount Rate so NEVA $0 Year 11 12 1 15 16 17 18 Saham 10 A1 : X f Time Value of Money - Future Value of L F 6 A B D E 1 Time Value of Money - Future Value of Lump Sum 2 Rate 3 Years $0.00 4 Initial Investment 5 6 7 8 9 10 11 12 13 14 15 16 F G A D E Time Value of Money - Present Value of Lump Sum Rate 3 Years $0.00 Initial Investment 6 6 7 8 9 10 11 12 13 14 15 16 17 5 18 19 20 21 Monthly Annual PV | FV PV-lymp Sum FV - Lump sum Type here to search F G A D E Time Value of Money - Present Value of Lump Sum Rate 3 Years $0.00 Initial Investment 6 6 7 8 9 10 11 12 13 14 15 16 17 5 18 19 20 21 Monthly Annual PV | FV PV-lymp Sum FV - Lump sum Type here to search E F B D Time Value of Money - Future Value Annuity Number of Years Rate of Return $0.00 Payment 1 2. 3 4 5 6 7 8 9 20 21 Monthly Annual PV PV - Lump Sum FV - Lump Sum Tyne here to search F G H Time Value of Money - Present Value Annuity Number of Years 3 Rate of Return $0.00 Payment 5 7 8 9 10 11 12 13 14 15 16 17 18 19 20 21 Monthly Annual PV F PV - Cump Sum FV-lump Sum NPY RATIOS Chpboard Tont Alignment Number C17 D E M N 1 8 4 G H Time Value of Money - Annual Compounding 2 3 5 6 7 SO SO 50 SO SO SO sol sol SO Sol $0 SO Year Interest Investment Value SO $0 so $0 9 so sol 10 so 50 A 1 2 Rate of Return 3 Initial Investment 4 5 6 7 B 9 10 11 12 13 14 15 16 17 18 19 20 21 - Dv-tump sam 3 Type here to search


