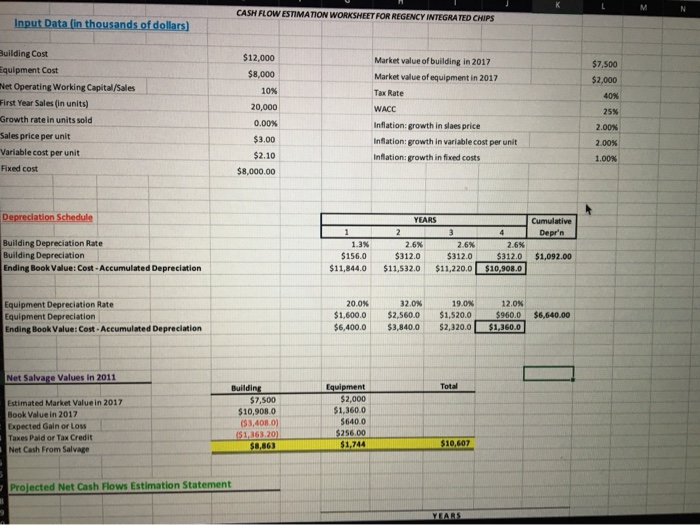
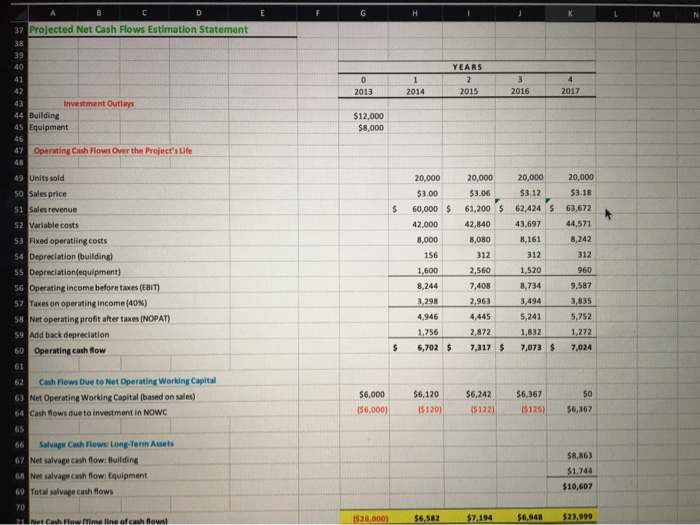
Using the incremental cash flows (the cash flows were computed and are shown in the attached image below of the spreadsheet), compute the following (show work please) and state in each case whether the company should go ahead with the project.
- Payback
- NPV
- IRR
- Profitability Index


CASH FLOW ESTIMATION WORKSHEET FOR REGENCY INTEGRATED CHIPS Input Data (in thousands of dollars) $12,000 Building Cost Equipment Cost Net Operating Working Capital/Sales First Year Sales (in units) Growth rate in units sold Sales price per unit Variable cost per unit Fixed cost $8,000 10% 20,000 0.00% $3.00 $2.10 $8,000.00 Market value of building in 2017 Market value of equipment in 2017 Tax Rate WACC Inflation growth in slaes price Inflation growth in variable cost per unit Inflation growth in fixed costs $7,500 $2,000 40% 25% 2.00% 2.00% 1.00% Depreciation Schedule Building Depreciation Rate Building Depreciation Ending Book Value: Cost - Accumulated Depreciation YEARS Cumulative 1234 Depr'n 1.3% 2.6% 2.6 2.6% $156.0 $312.0 $312.0 $312.0 $1,092.00 $11,844.0 $11,532.0 $11,220,0 $10,908.0 Equipment Depreciation Rate Equipment Depreciation Ending Book Value: Cost. Accumulated Depreciation 20.0% $1,600.0 $6,400.0 32.0% $2,560.0 $3,840.0 19.0% $1,520.0 $2,320.01 12.0% $960,0 $1,360.0 $6,640.00 Net Salvage Values in 2011 Estimated Market value in 2017 Book Value in 2017 Expected Gain or loss Taxes Pald or Tax Credit Net Cash From Salvage Building $7,500 $10,908.0 ($3,4080) IS 1.363.20 S8,863 Equipment $2.000 $1,360.0 $6400 $256.00 $1.744 Projected Net Cash Flows Estimation Statement 37 Projected Net Cash Flows Estimation Statement 2013 2015 2016 2017 44 Building 45 Equipment $12,000 $8,000 47 Operating Cash Flows Over the Project's Life 20,000 $3.12 62,424 $ 43,697 8,161 312 20.000 $3.18 63,672 44,571 8,242 312 20,000 $3.00 60,000 $ 42.000 8,000 156 1,600 8.244 3.29 4,946 1,756 6,702 $ 20,000 $3.06 61,200 $ 42,840 8,080 312 2.560 7,408 2,963 4,445 2,872 7,317 $ 1.520 49 Units sold 50 Sales price 51 Sales revenue 52 Variable costs 53 Fixed operating costs 54 Depreciation (building) 55 Depreciation equipment) 56 Operating income before taxes (EBIT) 57 Taxes on operating income (40%) 58 Net operating profit after taxes (NOPAT) 59 Add back depreciation 60 Operating cash flow 61 62 Cash Flows Due to Net Operating Working Capital 63 Net Operating Working Capital (based on sales) 64 Cash flows due to investment in NOWC 960 9,587 8,734 3.494 5,241 1,832 7,073 $ 7,024 $6,000 156,000) $6,120 15120) $6,242 (5122) $6,367 15125) $6,367 66 Salvage Cash Flows: Long-Term Assets 67 Net salvage cash flow: Building 68 Net salvage cash flow: Equipment 69 Total salvage cash flows $8,863 $1,744 $10,607 2. Net Cash Flow Mme line of cash flows 1526,000) $6,582 $2,194 $6,948 $23,999


