

Question
Using the info in the attached images, please help me verify the formula to calculate accurately: 1) Current ratio = total current assets / total
Using the info in the attached images, please help me verify the formula to calculate accurately: 1) Current ratio = "total current assets" / "total current liabilities" 2) Quick Ratio = ("total current assets"-"inventories") / "total current liabilities" 3) Cash Ratio = "cash" / "total current liabilities" 4) Times Interest Earned Ratio = "Earnings before interest & taxes" / "interest expense" 5) Total debt ratio = "total liabilities" / "total assets" 6) ROA = "Net income" / " total assets" 7) ROE = "Net income" / "owners' equity" 8) Profit Margin = "Net income" / "revenues" 9) Total Asset Turnover = "Revenues" / "total assets" 10) Equity Multiplier = "total assets" / "owners' equity" 11) Inventory Turnover ratio = " cost of goods sold" / "inventories" 12) Receivables Turnover Ratio = "Revenues" / "Receivables" 13) Payable Turnover Ratio = "cost of goods sold" / "accounts payable" 14) Dividend payout = "dividend per share" / "earnings per share"
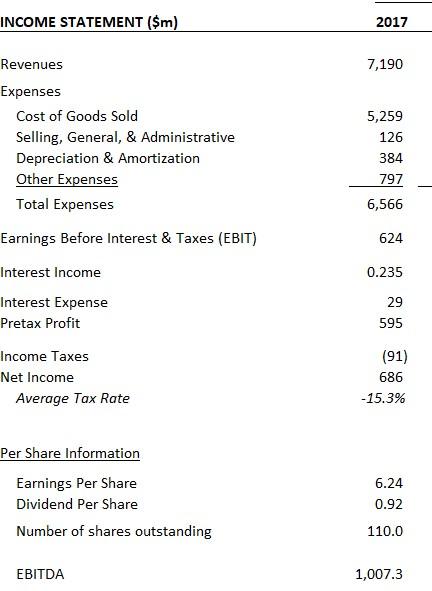
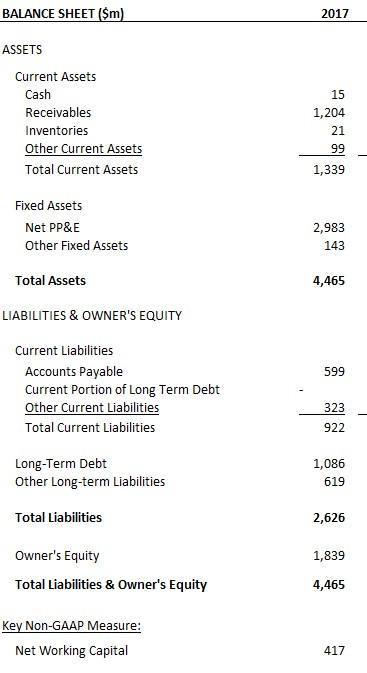
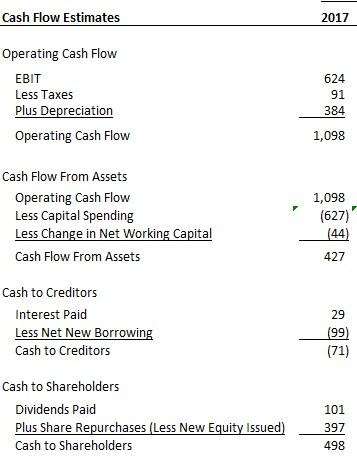
INCOME STATEMENT ($m) 2017 7,190 Revenues Expenses Cost of Goods Sold Selling, General, & Administrative Depreciation & Amortization Other Expenses Total Expenses Earnings Before Interest & Taxes (EBIT) 5,259 126 384 797 6,566 624 Interest Income 0.235 Interest Expense Pretax Profit 29 595 Income Taxes Net Income Average Tax Rate (91) 686 -15.3% Per Share Information Earnings Per Share Dividend Per Share Number of shares outstanding 6.24 0.92 110.0 EBITDA 1,007.3 BALANCE SHEET($m) 2017 ASSETS Current Assets Cash Receivables Inventories Other Current Assets Total Current Assets 15 1,204 21 99 1,339 Fixed Assets Net PP&E Other Fixed Assets 2,983 143 Total Assets 4,465 LIABILITIES & OWNER'S EQUITY 599 Current Liabilities Accounts Payable Current Portion of Long Term Debt Other Current Liabilities Total Current Liabilities 323 922 Long-Term Debt Other Long-term Liabilities 1,086 619 Total Liabilities 2,626 1,839 Owner's Equity Total Liabilities & Owner's Equity 4,465 Key Non-GAAP Measure: Net Working Capital 417 Cash Flow Estimates 2017 Operating Cash Flow EBIT Less Taxes Plus Depreciation Operating Cash Flow 624 91 384 1,098 Cash Flow From Assets Operating Cash Flow Less Capital Spending Less Change in Net Working Capital Cash Flow From Assets 1,098 (627) (44) 427 Cash to Creditors Interest Paid Less Net New Borrowing Cash to Creditors 29 (99) (71) Cash to Shareholders Dividends Paid Plus Share Repurchases (Less New Equity Issued) Cash to Shareholders 101 397 498
Step by Step Solution
There are 3 Steps involved in it
Step: 1

Get Instant Access to Expert-Tailored Solutions
See step-by-step solutions with expert insights and AI powered tools for academic success
Step: 2

Step: 3
Ace Your Homework with AI
Get the answers you need in no time with our AI-driven, step-by-step assistance
Get Started
Bitcoin Wallet
Authors: Lamont Zywiec
1st Edition
979-8355415426