Using the information in the excel, calculate the following financial ratios for all years. Analyze the ratios and comment.
a. Current ratio
b. Quick ratio
c. Total debt to assets
d. Times interest earned
e. Inventory days outstanding
f.AR days outstanding
g. Gross margin
h. Profit margin
i.ROA
j.EBIT margin
k. EBITDA margin
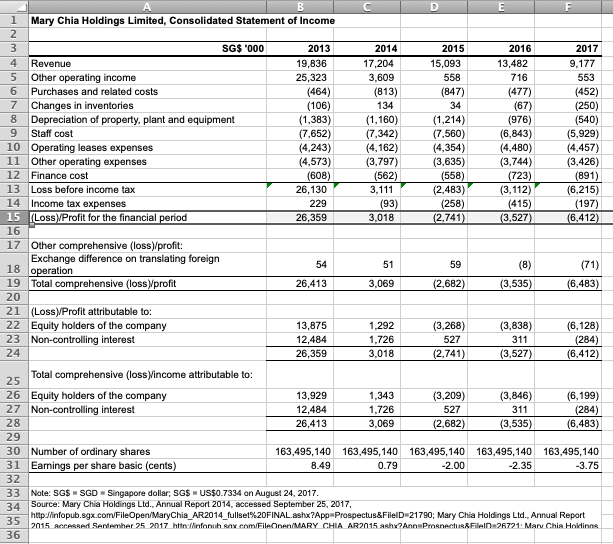
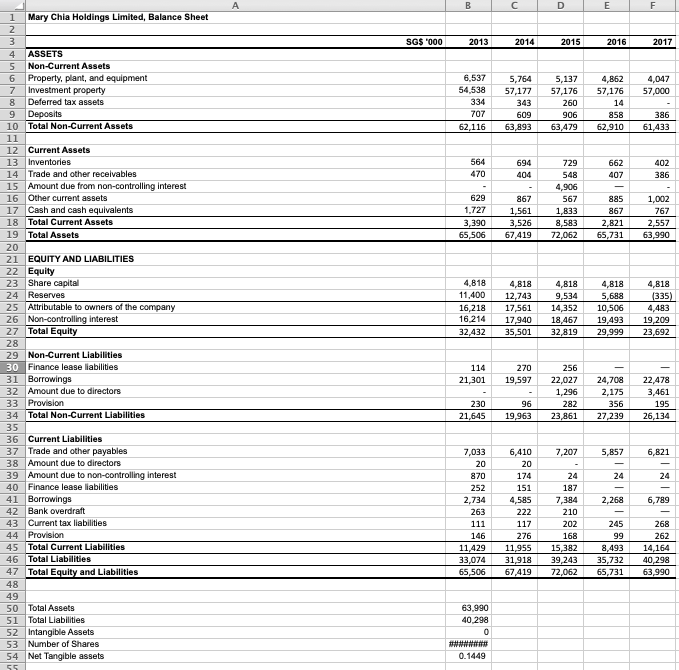
B D E F 1 Mary Chia Holdings Limited, Consolidated Statement of Income 2 3 SG$ '000 2013 2014 2015 2016 2017 4 Revenue 19,836 17,204 15,093 13,482 9.177 5 Other operating income 25,323 3,609 55B 716 553 6 Purchases and related costs (464) (813) (847) (477) (452) 7 Changes in inventories (106) 134 34 (67) (250) 8 Depreciation of property, plant and equipment (1,383) (1,160) (1,214) (976) (540) 9 Staff cost (7,652) (7,342) (7,560) (6,843) (5,929) 10 Operating leases expenses (4,243) (4,162) (4,354) (4,480) (4,457) 11 Other operating expenses (4,573) (3,797) (3,635) (3,744) (3,426) 12 Finance cost (608) (562) (558) (723) (891) 13 Loss before income tax 26,130 3,111 (2,483) (3,112) (6,215) 14 Income tax expenses 229 (93) (258) (415) (197) 15 (Loss)/Profit for the financial period 26,359 3,018 (2,741) (3,527) (6,412) 16 17 Other comprehensive (loss)/profit: Exchange difference on translating foreign 54 51 18 operation 59 (8) (71) 19 Total comprehensive (loss)profit 26,413 3,069 (2.682) (3,535) (6,483) 20 21 (Loss)/Profit attributable to: 22 Equity holders of the company 13,875 1,292 (3.268) (3,838) (6,128) 23 Non-controlling interest 12,484 1,726 527 311 (284) 24 26,359 3,018 (2,741) (3,527) (6,412) 25 Total comprehensive (lossincome attributable to: 26 Equity holders of the company 13,929 1,343 (3,209) (3,846) (6,199) 27 Non-controlling interest 12,484 1,726 527 311 (284) 28 26,413 3,069 (2.682) (3,535) (6,483) 29 30 Number of ordinary shares 163,495,140 163,495,140 163,495,140 163,495,140 163,495,140 31 Earnings per share basic (cents) 8.49 0.79 -2.00 -2.35 -3.75 32 33 Note: SG$SGD - Singapore dollar, SG$ - US$0.7334 on August 24, 2017. 34 Source: Mary Chia Holdings Ltd.. Annual Report 2014. accessed September 25, 2017, 35 http://infopub.sgx.com/FileOpen/MaryChia_AR2014_fullset%20FINAL.ashx?App Prospectus&FileID 21790; Mary Chia Holdings Ltd., Annual Report 2015 Accessed Sentember 25 2017 http://infonu axcom/FileOnen/MARY CHIA AR 2015 ashx? Ann Prospectus&FileID=26721. Mary Chia Holdings 36 B D E F SG$ 000 2013 2014 2015 2016 2017 4,047 57,000 6.537 54,538 334 707 62,116 5,764 57,177 343 609 63,893 5,137 57,176 260 906 63,479 4,862 57,176 14 858 62,910 386 61,433 564 470 694 404 662 407 402 386 629 1,727 3,390 65,506 867 1,561 3,526 67,419 729 548 4,906 567 1,833 8,583 72,062 885 867 2,821 65,731 1,002 767 2,557 63,990 4,818 11,400 16,218 16,214 32,432 4,818 12,743 17,561 17,940 35,501 4,818 9,534 14,352 18,467 32,819 4,818 5,688 10,506 19,493 29,999 4,818 (335) 4,483 19,209 23,692 1 Mary Chia Holdings Limited, Balance Sheet 2 3 4 ASSETS 5 Non-Current Assets 6 Property, plant, and equipment 7 Investment property 8 Deferred tax assets 9 Deposits 10 Total Non-Current Assets 11 12 Current Assets 13 Inventories 14 Trade and other receivables 15 Amount due from non-controlling interest 16 Other current assets 17 Cash and cash equivalents 18 Total Current Assets 19 Total Assets 20 21 EQUITY AND LIABILITIES 22 Equity 23 Share capital 24 Reserves 25 Attributable to owners of the company 26 Non-controlling interest 27 Total Equity 28 29 Non-Current Liabilities 30 Finance lease liabilities 31 Borrowings 32 Amount due to directors 33 Provision 34 Total Non-Current Liabilities 35 36 Current Liabilities 37 Trade and other payables 38 Amount due to directors 39 Amount due to non-controlling interest 40 Finance lease liabilities 41 Borrowings 42 Bank overdraft 43 Current tax liabilities 44 Provision 45 Total Current Liabilities 46 Total Liabilities 47 Total Equity and Liabilities 48 49 50 Total Assets 51 Total Liabilities 52 Intangible Assets 53 Number of Shares 54 Net Tangible assets 55 114 21,301 270 19,597 256 22,027 1,296 282 23,861 24,708 2,175 356 27,239 22,478 3,461 195 26,134 230 21,645 96 19,963 7,207 5,857 6,821 6,410 20 174 24 24 151 187 2,268 6,789 7,033 20 870 252 2,734 263 111 146 11,429 33,074 65,506 4,585 222 117 276 11,955 31,918 67,419 7,384 210 202 168 15,382 39,243 72,062 245 99 8,493 35 732 65,731 268 262 14,164 40,298 63,990 63.990 40.298 0 0.1449