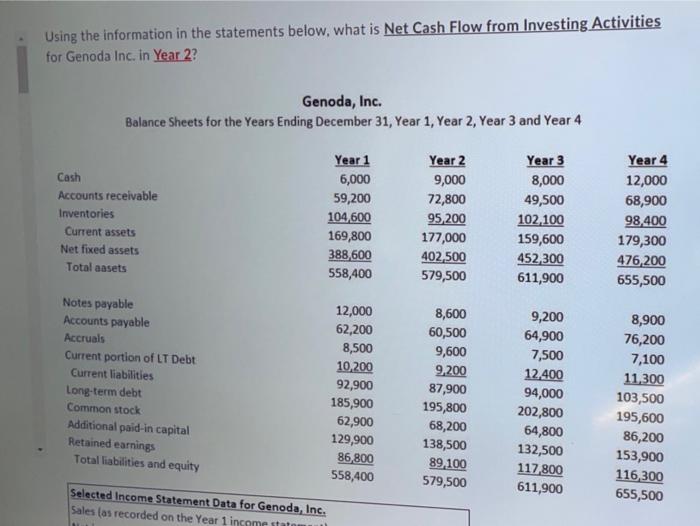
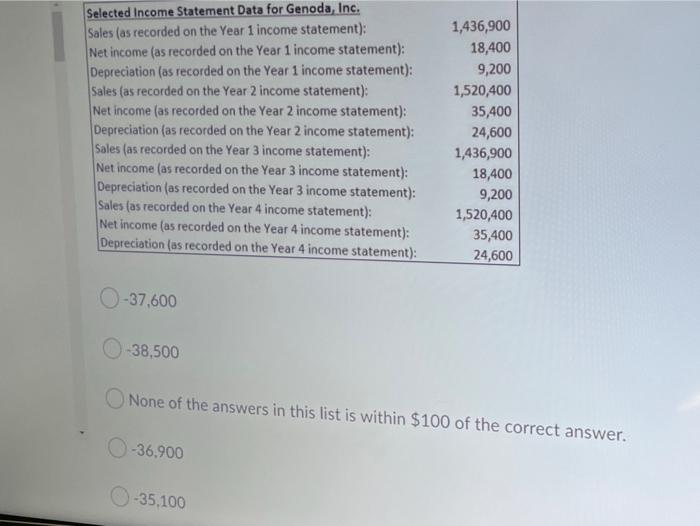
Using the information in the statements below, what is Net Cash Flow from Investing Activities for Genoda Inc. in Year 2? Genoda, Inc. Balance Sheets for the Years Ending December 31, Year 1, Year 2, Year 3 and Year 4 Cash Accounts receivable Inventories Current assets Net fixed assets Total aasets Year 1 6,000 59,200 104,600 169,800 388,600 558,400 Year 2 9,000 72,800 95,200 177,000 402.500 579,500 Year 3 8,000 49,500 102,100 159,600 452,300 611,900 Year 4 12,000 68,900 98,400 179,300 476,200 655,500 Notes payable Accounts payable Accruals Current portion of LT Debt Current liabilities Long-term debt Common stock Additional paid-in capital Retained earnings Total liabilities and equity 12,000 62,200 8,500 10,200 92,900 185,900 62,900 129,900 86,800 558,400 8,600 60,500 9,600 9.200 87,900 195,800 68,200 138,500 89.100 579,500 9,200 64,900 7,500 12,400 94,000 202,800 64,800 132,500 117,800 611,900 8,900 76,200 7,100 11,300 103,500 195,600 86,200 153,900 116,300 655,500 Selected Income Statement Data for Genoda, Inc. Sales las recorded on the Year 1 income stato Selected Income Statement Data for Genoda, Inc. Sales (as recorded on the Year 1 income statement): Net income (as recorded on the Year 1 income statement): Depreciation (as recorded on the Year 1 income statement): Sales (as recorded on the Year 2 income statement): Net income (as recorded on the Year 2 income statement): Depreciation (as recorded on the Year 2 income statement); Sales (as recorded on the Year 3 income statement): Net income (as recorded on the Year 3 income statement): Depreciation (as recorded on the Year 3 income statement): Sales (as recorded on the Year 4 income statement): Net income (as recorded on the Year 4 income statement): Depreciation (as recorded on the Year 4 income statement): 1,436,900 18,400 9,200 1,520,400 35,400 24,600 1,436,900 18,400 9,200 1,520,400 35,400 24,600 -37,600 -38,500 None of the answers in this list is within $100 of the correct answer. 0-36,900 -35.100