Answered step by step
Verified Expert Solution
Link Copied!

Question

1 Approved Answer

Using the OccupancyRate and LotCode columns,construct box plots for each parking lot. You can use Insert > Insert Statistic Chart >Box and Whisker for this
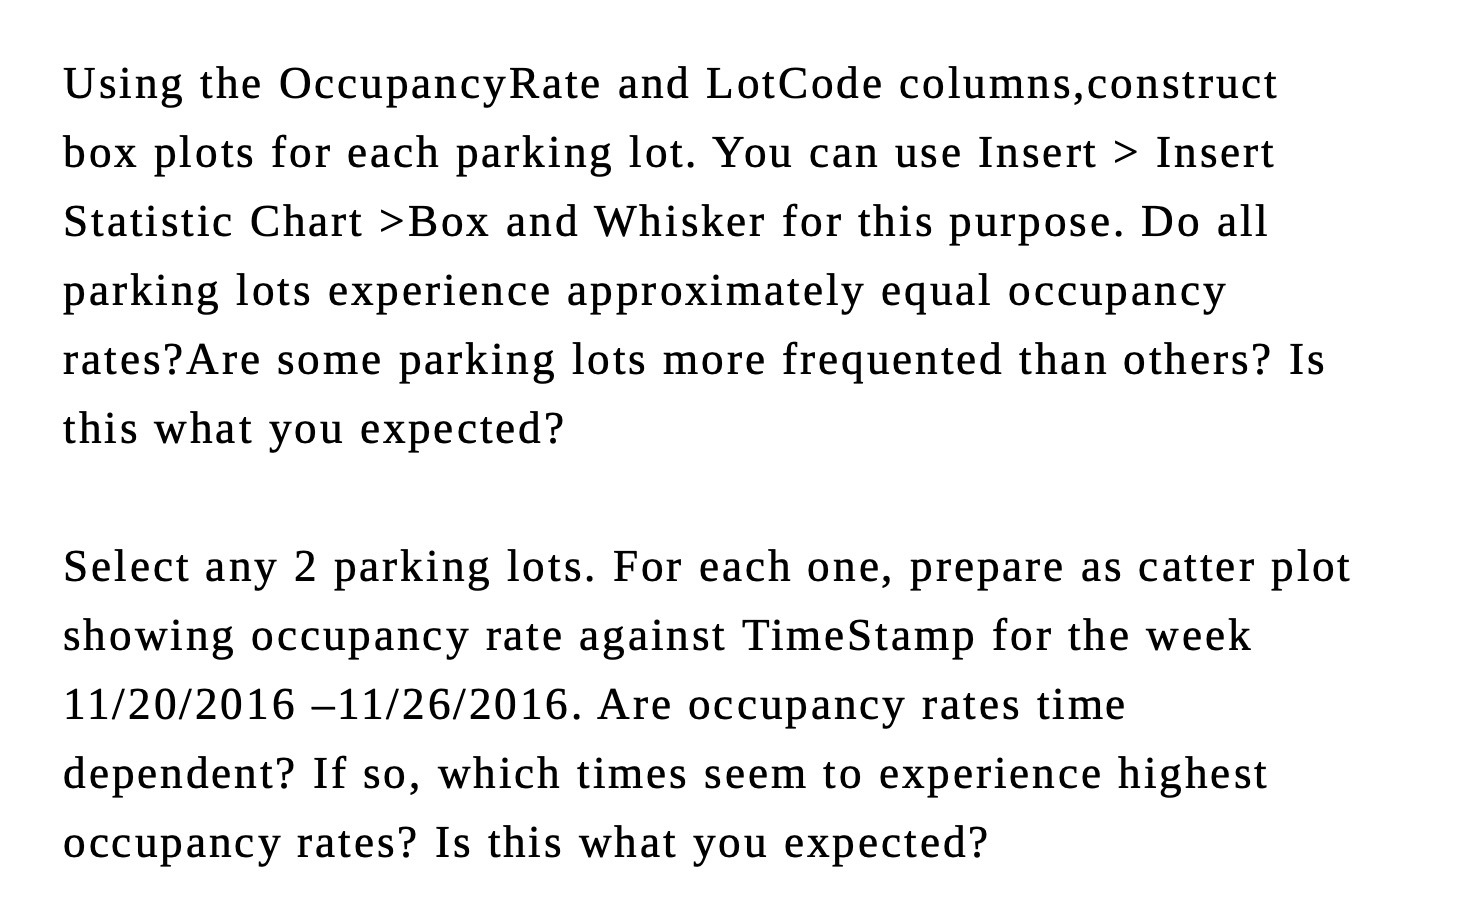
image text in transcribed
Using the OccupancyRate and LotCode columns,construct box plots for each parking lot. You can use Insert > Insert Statistic Chart >Box and Whisker for this purpose. Do all parking lots experience approximately equal occupancy rates?Are some parking lots more frequented than others? Is this what you expected? Select any 2 parking lots. For each one, prepare as catter plot showing occupancy rate against TirneStamp for the week 11/20/2016 11/26/2016. Are occupancy rates time dependent? If so, which times seem to experience highest occupancy rates? Is this what you expected

Step by Step Solution

There are 3 Steps involved in it

Step: 1

blur-text-image

Get Instant Access to Expert-Tailored Solutions

See step-by-step solutions with expert insights and AI powered tools for academic success

Step: 2

blur-text-image

Step: 3

blur-text-image

Ace Your Homework with AI

Get the answers you need in no time with our AI-driven, step-by-step assistance

Get Started

Recommended Textbook for

Econometric Analysis

Authors: William H. Greene

5th Edition

130661899, 978-0130661890

More Books

Students also viewed these Economics questions