

Question
Using the orange curve (square symbols), plot the present value of each of the expected future dividends for years 10, 20, and 50. The resulting
Using the orange curve (square symbols), plot the present value of each of the expected future dividends for years 10, 20, and 50. The resulting curve will illustrate how the PV of a particular dividend payment will decrease depending on how far from today the dividend is expected to be received.
Note: Round each of the discounted values of the dividends to the nearest tenth decimal place before plotting it on the graph. You can mouse over the points in the graph to see their coordinates.
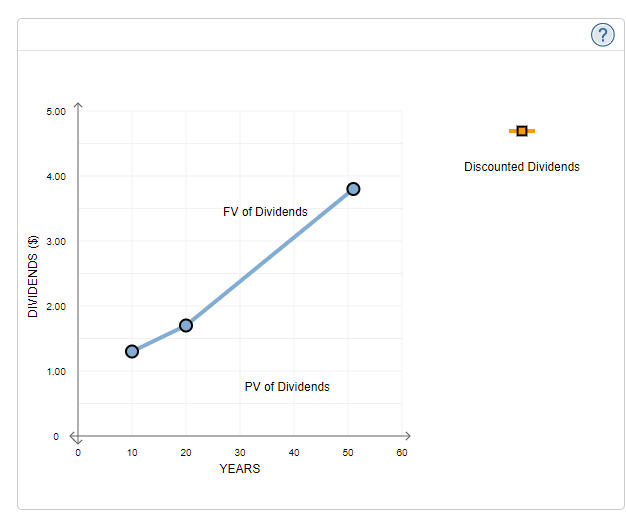
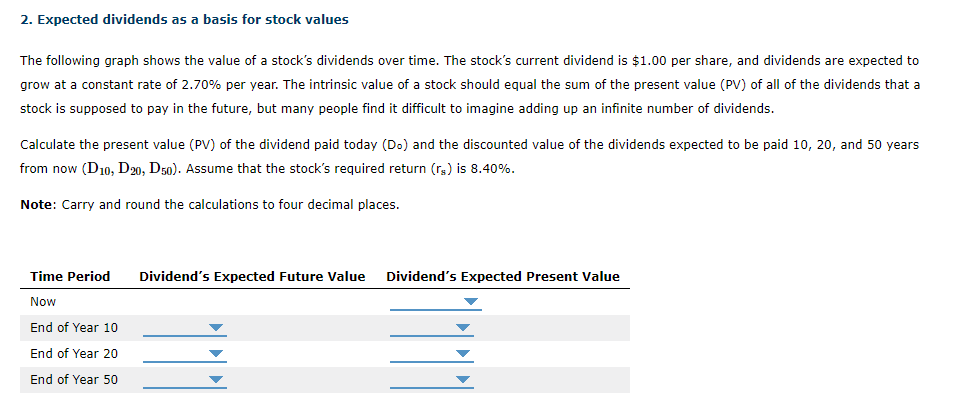
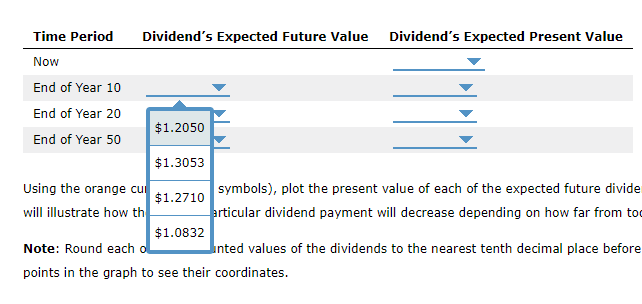
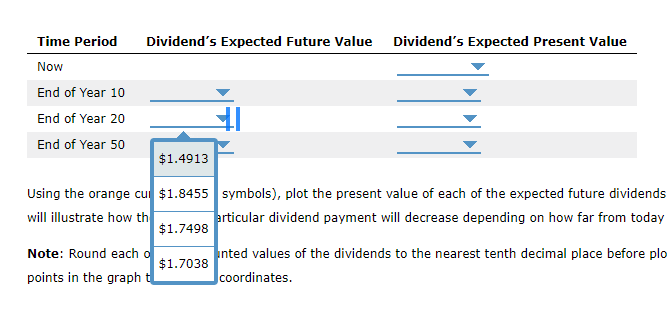
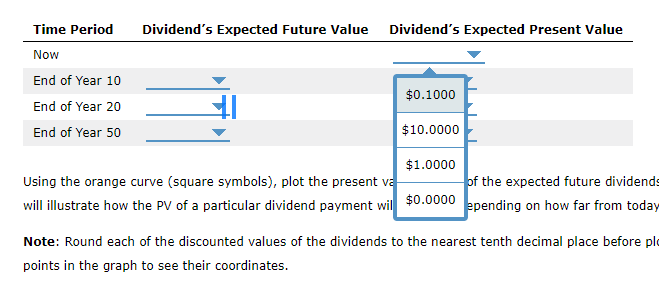
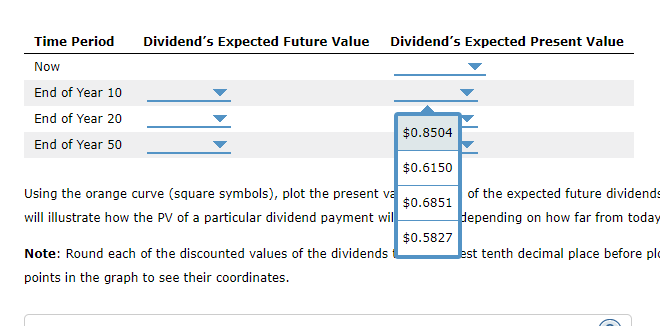
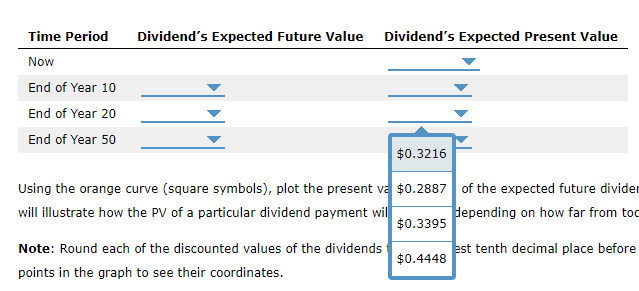
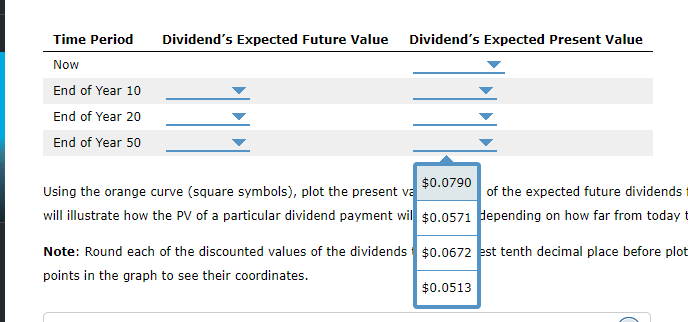
2. Expected dividends as a basis for stock values The following graph shows the value of a stock's dividends over time. The stock's current dividend is $1.00 per share, and dividends are expected to grow at a constant rate of 2.70% per year. The intrinsic value of a stock should equal the sum of the present value (PV) of all of the dividends that a stock is supposed to pay in the future, but many people find it difficult to imagine adding up an infinite number of dividends. Calculate the present value (PV) of the dividend paid today (D.) and the discounted value of the dividends expected to be paid 10, 20, and 50 years from now (D10, D20, D50). Assume that the stock's required return (rs) is 8.40%. Note: Carry and round the calculations to four decimal places. Dividend's Expected Future Value Dividend's Expected Present Value Time Period Now End of Year 10 End of Year 20 End of Year 50 Time Period Dividend's Expected Future Value Dividend's Expected Present Value Now End of Year 10 End of Year 20 $1.2050 End of Year 50 $1.3053 Using the orange cu symbols), plot the present value of each of the expected future divide $1.2710 will illustrate how th articular dividend payment will decrease depending on how far from to $1.0832 Note: Round each o Inted values of the dividends to the nearest tenth decimal place before points in the graph to see their coordinates. Dividend's Expected Future Value Dividend's Expected Present Value Time Period Now End of Year 10 End of Year 20 End of Year 50 $1.4913 Using the orange cu $1.8455 symbols), plot the present value of each of the expected future dividends will illustrate how th articular dividend payment will decrease depending on how far from today $1.7498 Note: Round each o nted values of the dividends to the nearest tenth decimal place before plo $1.7038 points in the graph coordinates. Dividend's Expected Future Value Dividend's Expected Present Value Time Period Now End of Year 10 End of Year 20 End of Year 50 Using the orange cul $4.3289 symbols), plot the present value of each of the expected future dividends will illustrate how th $4.1042 prticular dividend payment will decrease depending on how far from today Note: Round each o $3.7890 nted values of the dividends to the nearest tenth decimal place before plot points in the graph ti coordinates. $3.4979 Dividend's Expected Future Value Dividend's Expected Present Value Time Period Now End of Year 10 End of Year 20 End of Year 50 $0.1000 $10.0000 $1.0000 Using the orange curve (square symbols), plot the present va of the expected future dividende will illustrate how the PV of a particular dividend payment will $0.0000 spending on how far from today Note: Round each of the discounted values of the dividends to the nearest tenth decimal place before pla points in the graph to see their coordinates. Time Period Dividend's Expected Future Value Dividend's Expected Present Value Now End of Year 10 End of Year 20 $0.8504 End of Year 50 $0.6150 Using the orange curve (square symbols), plot the present va of the expected future dividende $0.6851 will illustrate how the PV of a particular dividend payment wil Hepending on how far from today $0.5827 Note: Round each of the discounted values of the dividends Jest tenth decimal place before plo points in the graph to see their coordinates. Dividend's Expected Future Value Dividend's Expected Present Value Time Period Now End of Year 10 End of Year 20 End of Year 50 $0.3216 Using the orange curve (square symbols), plot the present va $0.2887 of the expected future divider will illustrate how the PV of a particular dividend payment wil Hepending on how far from toc $0.3395 Note: Round each of the discounted values of the dividends est tenth decimal place before $0.4448 points in the graph to see their coordinates. Dividend's Expected Future Value Dividend's Expected Present Value Time Period Now End of Year 10 End of Year 20 End of Year 50 $0.0790 Using the orange curve (square symbols), plot the present va of the expected future dividends will illustrate how the PV of a particular dividend payment wil $0.0571 depending on how far from today Note: Round each of the discounted values of the dividends $0.0672 est tenth decimal place before plot points in the graph to see their coordinates. $0.0513 ? 5.00 Discounted Dividends 4.00 0 FV of Dividends 3.00 DIVIDENDS ($) 2.00 0 1.00 PV of Dividends 0 10 20 40 50 60 30 YEARS
Step by Step Solution
There are 3 Steps involved in it
Step: 1

Get Instant Access to Expert-Tailored Solutions
See step-by-step solutions with expert insights and AI powered tools for academic success
Step: 2

Step: 3
Ace Your Homework with AI
Get the answers you need in no time with our AI-driven, step-by-step assistance
Get Started
Foundations Of Financial Management
Authors: Stanley Block, Geoffrey Hirt, Bartley Danielsen
17th Edition
126001391X, 978-1260013917