

Question
Using the sample data, compute by hand Pearson's correlation between the poverty rate (X) and murder rate (Y) for US states and then test the
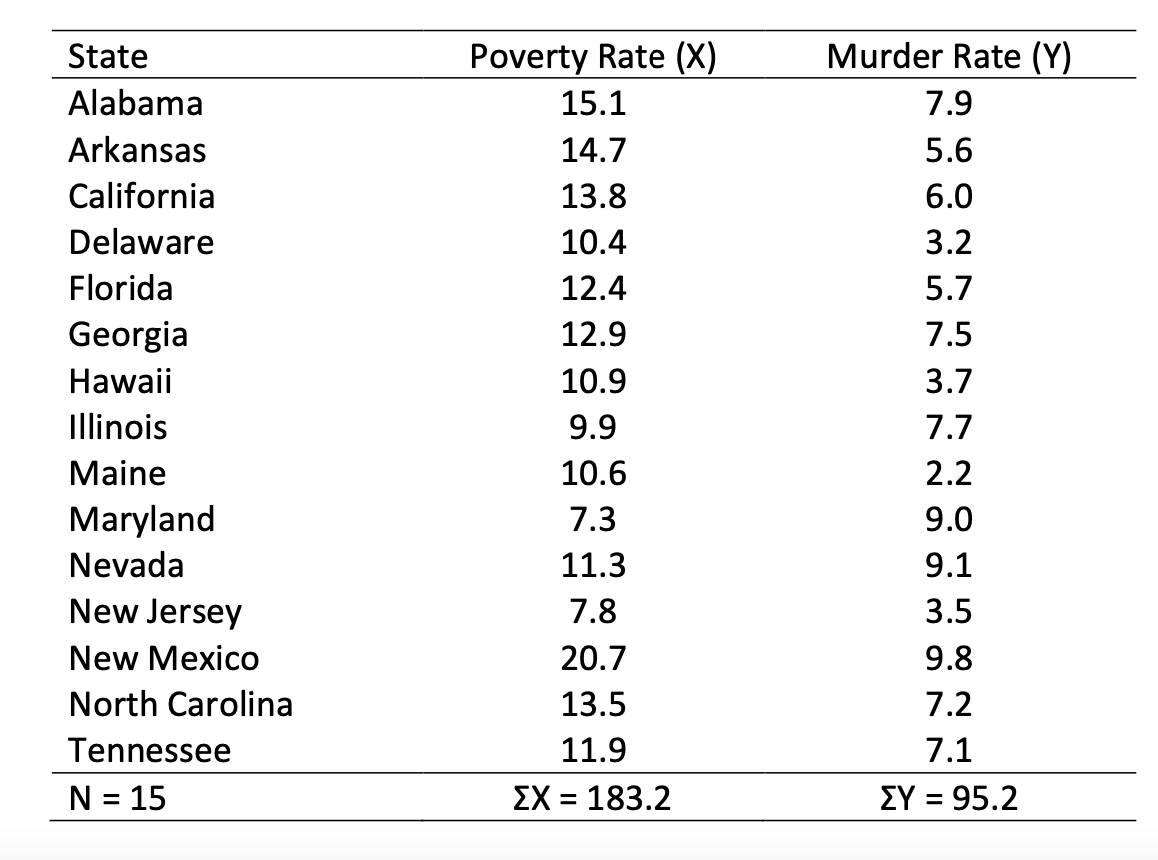
Using the sample data, compute by hand Pearson's correlation between the poverty rate (X) and murder rate (Y) for US states and then test the null hypothesis that the correlation in the population equals 0 (? = 0). Interpret results.
Step by Step Solution
There are 3 Steps involved in it
Step: 1

Get Instant Access to Expert-Tailored Solutions
See step-by-step solutions with expert insights and AI powered tools for academic success
Step: 2

Step: 3
Ace Your Homework with AI
Get the answers you need in no time with our AI-driven, step-by-step assistance
Get Started
Algebra And Trigonometry, Enhanced
Authors: Cynthia Y Young
4th Edition
1119320860, 9781119320869