Answered step by step
Verified Expert Solution
Question
1 Approved Answer
Using the SAS code and outputs below, answer the following questions. a) Which pair of variables is the most positively correlated and gives the


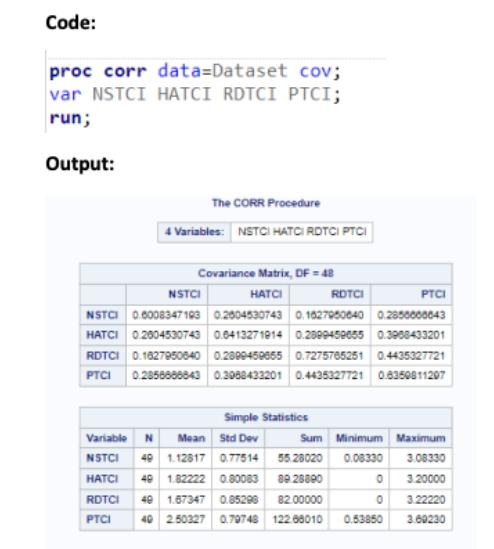
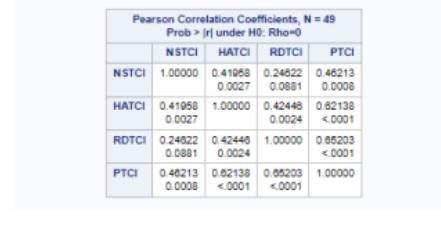
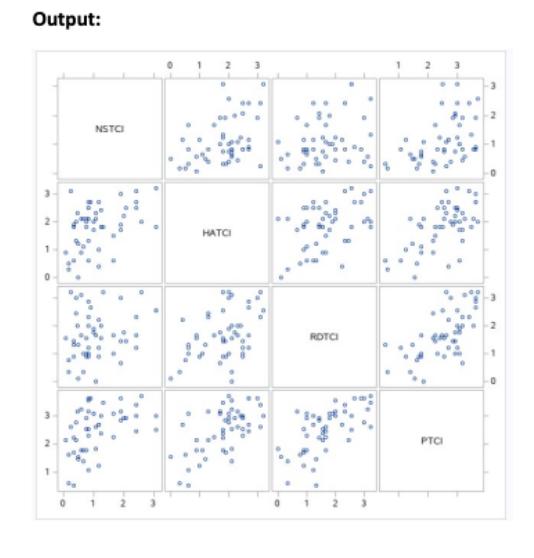
Using the SAS code and outputs below, answer the following questions. a) Which pair of variables is the most positively correlated and gives the associated correlation and p-value? b) Which pair of variables is the most negatively correlated (if any) otherwise the least correlated and give the associated correlation and p-value? c) What is the null hypothesis used in PROC CORR? d) Name the parameter being tested and its value under the null in PROC CORR. 1+1+2+1 5 marks Code: proc corr data=Dataset cov; var NSTCI HATCI RDTCI PTCI; run; Output: The CORR Procedure 4 Variables: NSTCI HATCI RDTCI PTCI NSTC Covariance Matrix, DF = 48 HATCI RDTCI NSTC 66006347183 02004532743 01027852040 PTCI 0.2850000643 HATCI 0.2604530743 0.0413271914 0.2809459655 0.3988433201 RDTCI 0.1627950640 0.2899459655 0.7275765251 0.4435327721 PTCI 0.2858888843 0.3988433201 0.4435327721 0.6350811207 Simple Statistics Variable N Mean Std Dev Sum Minimum Maximum NSTCI 49 1.12817 0.77514 55.28020 0.08330 3.08330 HATCI 49 1.82222 0.80083 RDTCI 49 1.67347 0.85298 82.00000 PTCI 40 2.50327 0.79748 122.68010 89.28890 0 3.20000 0 3.22220 0.53850 3.69230 Pearson Correlation Coefficients, N = 49 Probir under H0: Rho-0 NSTCI HATCI RDTCI PTCI NSIC 1.00000 0.41968 0.24822 0.46213 0.0027 0.0881 0.0008 HATCI 0.41958 1.00000 0.42448 0.62138 0.0024 Code: proc sgscatter data=Dataset; matrix NSTCI HATCI RDTCI PTCI; run; Output: NSTC 2 2 2 HATCI 3 3 ROTCI PTC
Step by Step Solution
There are 3 Steps involved in it
Step: 1

Get Instant Access to Expert-Tailored Solutions
See step-by-step solutions with expert insights and AI powered tools for academic success
Step: 2

Step: 3

Ace Your Homework with AI
Get the answers you need in no time with our AI-driven, step-by-step assistance
Get Started


