

Answered step by step
Verified Expert Solution
Question
1 Approved Answer
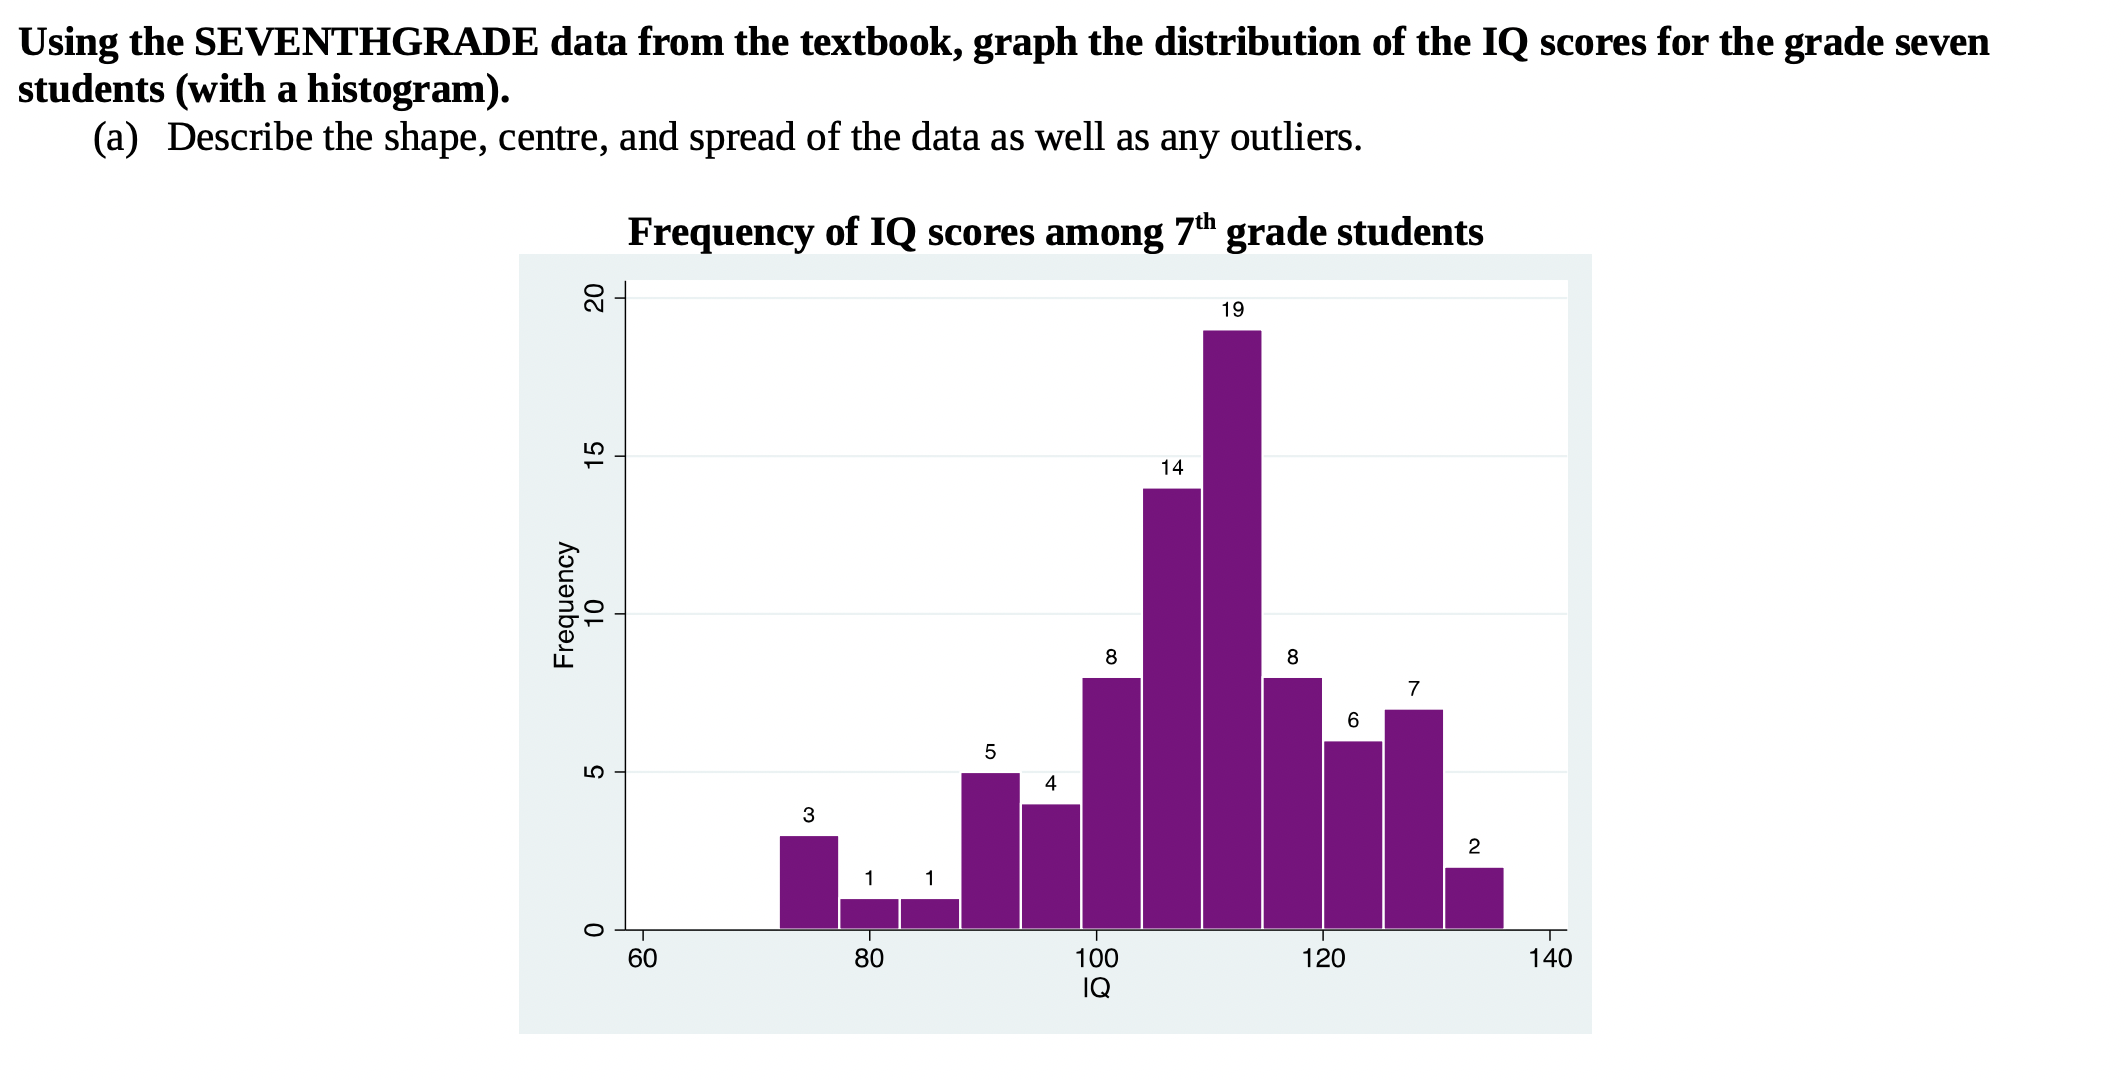
Using the SEVENTHGRADE data from the textbook, graph the distribution of the IQ scores for the grade seven students (with a histogram). (a) Describe the

Step by Step Solution
There are 3 Steps involved in it
Step: 1

Get Instant Access to Expert-Tailored Solutions
See step-by-step solutions with expert insights and AI powered tools for academic success
Step: 2

Step: 3
Ace Your Homework with AI
Get the answers you need in no time with our AI-driven, step-by-step assistance
Get Started
Stochastic Equations For Complex Systems Theoretical And Computational Topics
Authors: Stefan Heinz, Hakima Bessaih
1st Edition
3319182064, 9783319182063