

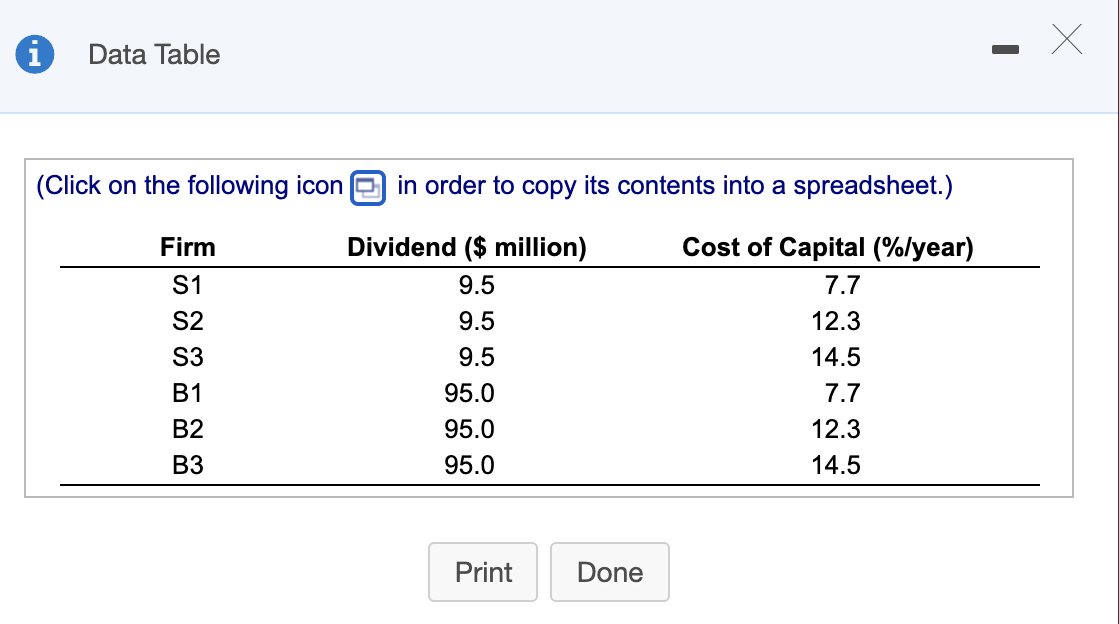
Question
using the table below and the market value of each firm are the following: i) $123.38 million ii) $77.24 million iii) $65.52 million iv )
using the table below and the market value of each firm are the following:
i) $123.38 million
ii) $77.24 million
iii) $65.52 million
iv) $1233.77 million
v) $772.36 million
vi) $655.17 million
Rank the three S firms by their market values and look at how their cost of capital is ordered. What would be the expected return for a self-financing portfolio that went long on the firm with the largest market value and shorted the firm with the lowest market value? Repeat using the B firms.
The expected return of a self-financing portfolio is asfollows:
S firms expected return is %. (Round to two decimalplaces.)
B firms expected return is .%. (Round to two decimalplaces.)
b. Rank all six firms by their market values. How does this ranking order the cost of capital? What would be the expected return for a self-financing portfolio that went long on the firm with the largest market value and shorted the firm with the lowest market value?
Ranking all six firms by their market values, the expected return of a self-financing portfolio is %. (Round to two decimal places.)
c. Repeat part (c) but rank the firms by the dividend yield instead of the market value. What can you conclude about the dividend yield ranking compared to the market value ranking?
Ranking the firms by dividend yield instead of market value, the expected return of a self-financing portfolio is .%. (Round to two decimal places.)
Step by Step Solution
There are 3 Steps involved in it
Step: 1

Get Instant Access to Expert-Tailored Solutions
See step-by-step solutions with expert insights and AI powered tools for academic success
Step: 2

Step: 3
Ace Your Homework with AI
Get the answers you need in no time with our AI-driven, step-by-step assistance
Get Started
Managerial Accounting W/Connect Plus 1
Authors: Garrison
14th Edition
0077654447, 978-0077654443